Unlock a world of possibilities! Login now and discover the exclusive benefits awaiting you.
- Qlik Community
- :
- All Forums
- :
- QlikView App Dev
- :
- Re: How to create region wise sales reports(dynami...
- Subscribe to RSS Feed
- Mark Topic as New
- Mark Topic as Read
- Float this Topic for Current User
- Bookmark
- Subscribe
- Mute
- Printer Friendly Page
- Mark as New
- Bookmark
- Subscribe
- Mute
- Subscribe to RSS Feed
- Permalink
- Report Inappropriate Content
How to create region wise sales reports(dynamic)
Hi I Have scenario,
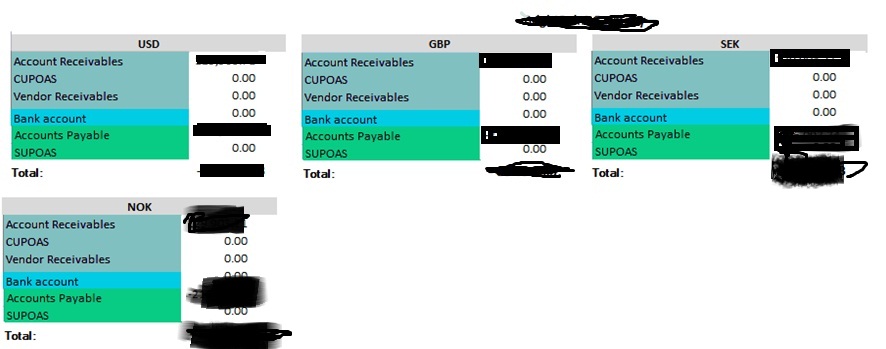
Want to create a straight table based on region(More of trellis)
Please find the attached doc for reference can any body help me on this.
Please do the needful
Regards
Thiru
- Mark as New
- Bookmark
- Subscribe
- Mute
- Subscribe to RSS Feed
- Permalink
- Report Inappropriate Content
Hi, can you attache a example of straight table whit the expected information?.
- Mark as New
- Bookmark
- Subscribe
- Mute
- Subscribe to RSS Feed
- Permalink
- Report Inappropriate Content
It's brute force, but I'd honestly just make four straight tables, then use set analysis to restrict the dimension value that shows in each, like sum({<Currency={'USD'}>} Amount). Get one table that looks perfect, then just clone it and edit the expression. That's exactly what I did with a dashboard a month or two ago.
I'm curious if someone knows a more clever method, though.
Edit: And it's not dynamic. If you add new regions/currencies, you have to add new charts. I'm afraid I've not thought of a dynamic solution.
- Mark as New
- Bookmark
- Subscribe
- Mute
- Subscribe to RSS Feed
- Permalink
- Report Inappropriate Content
HiJohn,
I am also soing the same,But looking for dynamic.
Thiru
- Mark as New
- Bookmark
- Subscribe
- Mute
- Subscribe to RSS Feed
- Permalink
- Report Inappropriate Content
Hi
Please find the attached excel for understanding
.png)
- Mark as New
- Bookmark
- Subscribe
- Mute
- Subscribe to RSS Feed
- Permalink
- Report Inappropriate Content
Create the Inline for currencies
CurrencySelection:
LOAD * inline [
CurrencySelection
USD
GBP
SEK
NOK ];
Create the Listbox for this CurrencySelection field on front end. Select one currency.
Create the Variable vCurrency on front end to store the selection and pass it to set analysis. Just call field name in Variable like below
=CurrencySelection
Now create the straight Table
Add dimensions needed and add the below expression
=Sum({<Currency ={"$(=vCurrency )"}>}Amount)
Using this approach you will not need to create the 5 different Straight table. Only one table will be sufficient
- Mark as New
- Bookmark
- Subscribe
- Mute
- Subscribe to RSS Feed
- Permalink
- Report Inappropriate Content
Hi Kushal,
My Requirement is need to create 5 different tables
So need to create That,It's More of Trellis,Please find the attached Excel for reference.
Thiru