Unlock a world of possibilities! Login now and discover the exclusive benefits awaiting you.
- Qlik Community
- :
- All Forums
- :
- QlikView App Dev
- :
- Re: How to display actuals till current month and ...
- Subscribe to RSS Feed
- Mark Topic as New
- Mark Topic as Read
- Float this Topic for Current User
- Bookmark
- Subscribe
- Mute
- Printer Friendly Page
- Mark as New
- Bookmark
- Subscribe
- Mute
- Subscribe to RSS Feed
- Permalink
- Report Inappropriate Content
How to display actuals till current month and budget for future months in qlikview bar chart?
Hi ,
I have a requirement to display actuals and budget for all months in a selected year, in which i have always one value selected in Year and Month fields. For eg , if March is selected, Jan , Feb & Mar should display actuals whereas Apr to Dec should display budget numbers. Can anyone pls help on this?
Attaching dummy data for the same
Regards,
Anilet Nirmal
- « Previous Replies
-
- 1
- 2
- Next Replies »
Accepted Solutions
- Mark as New
- Bookmark
- Subscribe
- Mute
- Subscribe to RSS Feed
- Permalink
- Report Inappropriate Content
Hi,
Attached an alternate approach to the same.
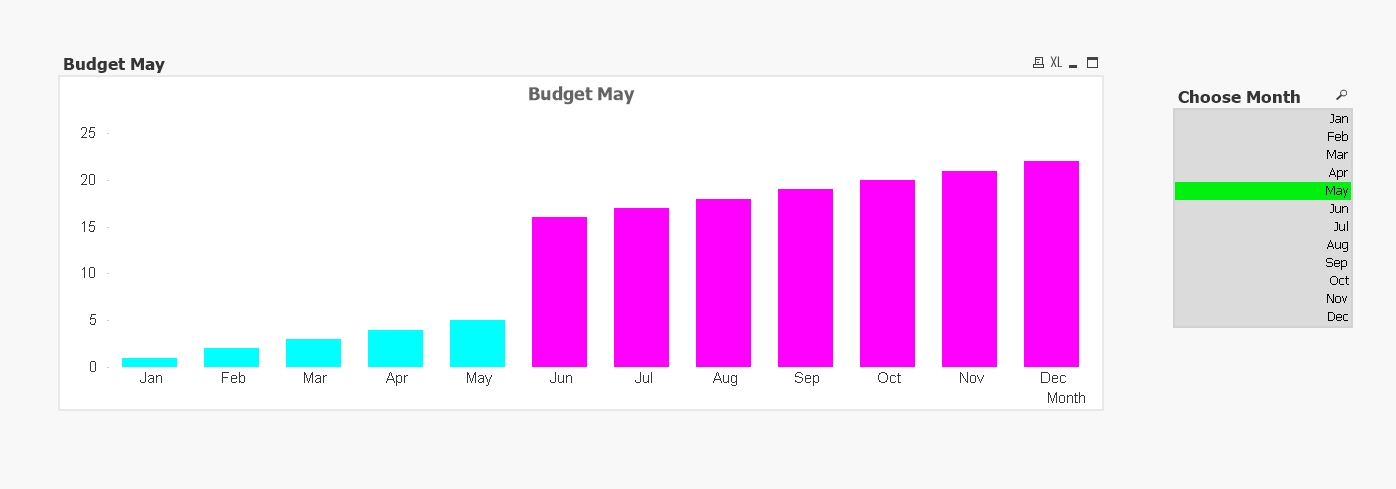
Expression:
=if(only({1}DATE(DATE_SKEY,'MM'))<=vMonth,sum({<DATE_SKEY,RevenueType={'Actuals'}>}Data)
,sum({<DATE_SKEY,RevenueType={'Budget'}>}Data))
Background color Expression:
=if(only({1}DATE(DATE_SKEY,'MM'))<=vMonth,LightCyan()
,LightMagenta())
Variable:
vMonth =DATE(DATE_SKEY,'MM')
LOAD SCRIPT
CrossTable(RevenueType, Data)
LOAD DATE_SKEY,
Actuals,
Budget
FROM
(ooxml, embedded labels, table is Sheet1);
If a post helps to resolve your issue, please accept it as a Solution.
- Mark as New
- Bookmark
- Subscribe
- Mute
- Subscribe to RSS Feed
- Permalink
- Report Inappropriate Content
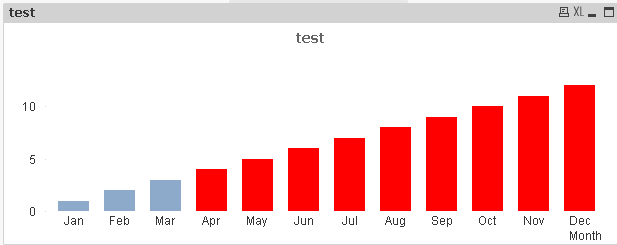
Hi
You need to add a Bar chart and having the follwoing
Dimension
Month(DATE_SKEY)
Measures
sum(Actuals)
sum(Budget)
- Mark as New
- Bookmark
- Subscribe
- Mute
- Subscribe to RSS Feed
- Permalink
- Report Inappropriate Content
Chart
- Mark as New
- Bookmark
- Subscribe
- Mute
- Subscribe to RSS Feed
- Permalink
- Report Inappropriate Content
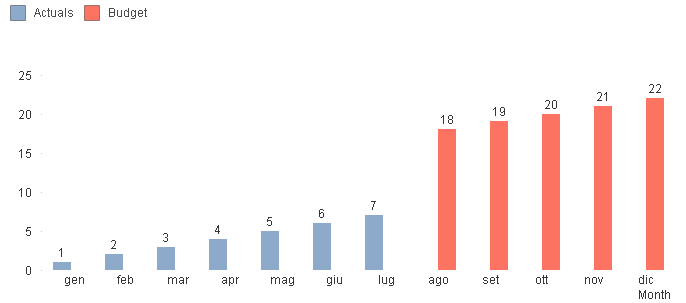
Hi Nirmal
Dim : Month
Expressions :
Actuals Sum({<Month={'<=$(=Max(Month))'}>} Actuals)
Budget Sum({<Month={'>$(=Max(Month))'}>} Budget)
- Mark as New
- Bookmark
- Subscribe
- Mute
- Subscribe to RSS Feed
- Permalink
- Report Inappropriate Content
Hi,
Attached an alternate approach to the same.
Expression:
=if(only({1}DATE(DATE_SKEY,'MM'))<=vMonth,sum({<DATE_SKEY,RevenueType={'Actuals'}>}Data)
,sum({<DATE_SKEY,RevenueType={'Budget'}>}Data))
Background color Expression:
=if(only({1}DATE(DATE_SKEY,'MM'))<=vMonth,LightCyan()
,LightMagenta())
Variable:
vMonth =DATE(DATE_SKEY,'MM')
LOAD SCRIPT
CrossTable(RevenueType, Data)
LOAD DATE_SKEY,
Actuals,
Budget
FROM
(ooxml, embedded labels, table is Sheet1);
If a post helps to resolve your issue, please accept it as a Solution.
- Mark as New
- Bookmark
- Subscribe
- Mute
- Subscribe to RSS Feed
- Permalink
- Report Inappropriate Content
Hi Vineeth,
I applied the below expression but the if condition is not satisfied and only budget values are displayed for all months without actuals. Can you please check my expression and i can not use two expressions for actuals and budget as I am using a stacked bar to calculate other measures. kindly help on this.
My expression is
if(only({1}DATE(DATE_SKEY,'MM'))<=vMonth,
sum({<DATE_SKEY,SEGMENT={'RBG'},INDICATOR_TYPE='ACTUALS'},tablename='AVGBS'},
YEAR=$(=max(YEAR))},MONTH=>}NII_REPORT_CURR)/1000
,sum({<DATE_SKEY,SEGMENT={'RBG'},INDICATOR_TYPE={'BUDGET'},tablename={'AVGBS'}
,YEAR={$(=max(YEAR))},MONTH=>}NII_REPORT_CURR)/1000)
Variable:vMonth =DATE(DATE_SKEY,'MM')
Regards,
Anilet Nirmal
- Mark as New
- Bookmark
- Subscribe
- Mute
- Subscribe to RSS Feed
- Permalink
- Report Inappropriate Content
You expression is missing Parenthesis, highlighted in bold
if(only({1}DATE(DATE_SKEY,'MM'))<=vMonth,
sum({<DATE_SKEY,SEGMENT={'RBG'},INDICATOR_TYPE= { 'ACTUALS'},tablename={'AVGBS'},
YEAR={$(=max(YEAR))},MONTH=>}NII_REPORT_CURR)/1000
,sum({<DATE_SKEY,SEGMENT={'RBG'},INDICATOR_TYPE={'BUDGET'},tablename={'AVGBS'}
,YEAR={$(=max(YEAR))},MONTH=>}NII_REPORT_CURR)/1000)
If a post helps to resolve your issue, please accept it as a Solution.
- Mark as New
- Bookmark
- Subscribe
- Mute
- Subscribe to RSS Feed
- Permalink
- Report Inappropriate Content
im so sorry , i missed the braces while editing but my expression is same as urs and im still having the same issue that only budget values are displayed for all months. I think the if condition is not satisfied so its going to else part .
my dimension is MONTH and I have ALWAYS ONE VALUE SELECTED VALUE in YEAR & MONTH fields.
Kindly help
if(only({1} DATE(DATE_SKEY,'MM')) <=vMonth,
sum({<
DATE_SKEY
,SEGMENT={'RBG'},INDICATOR_TYPE={'ACTUALS'}
,tablename={'AVGBS'}
,YEAR={$(=max(YEAR))}
,MONTH=
>}
NII_REPORT_CURR)/1000
,
sum({<
DATE_SKEY
,SEGMENT={'RBG'},INDICATOR_TYPE={'BUDGET'}
,tablename={'AVGBS'}
,YEAR={$(=max(YEAR))}
,MONTH=
>}
NII_REPORT_CURR)/1000
)
- Mark as New
- Bookmark
- Subscribe
- Mute
- Subscribe to RSS Feed
- Permalink
- Report Inappropriate Content
Hi Nirmal,
Sorry Didn't notice this earlier,
DATE(DATE_SKEY,'MM')) <=vMonth << Here I was converting the date_skey to Numeric month
I notice you already have a MONTH Field, for which you are ignoring selections. Is this from a separate table ? If not why not evaluate MONTH <= vMonth?
,YEAR={$(=max(YEAR))}
,MONTH=
>}
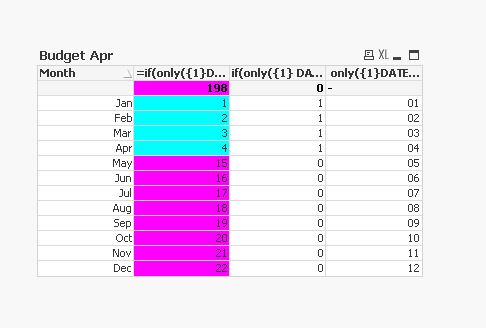
also can you create a clone of the chart , make it a straight table and add the below expressions(Below) to validate if the Month is being evaluated correctly.
= if(only({1} DATE(DATE_SKEY,'MM'))<=vMonth,1,0)
= only({1}DATE(DATE_SKEY,'MM'))
also check if vMonth =DATE(DATE_SKEY,'MM') is being evaluated correctly
My Screenshot for reference
If a post helps to resolve your issue, please accept it as a Solution.
- Mark as New
- Bookmark
- Subscribe
- Mute
- Subscribe to RSS Feed
- Permalink
- Report Inappropriate Content
May be something like this
sum({1<DATE_SKEY={"<=$(=only(DATE_SKEY))"}>}Actuals) + sum({1<DATE_SKEY={">$(=only(DATE_SKEY))"}>}Budget)
- « Previous Replies
-
- 1
- 2
- Next Replies »