Unlock a world of possibilities! Login now and discover the exclusive benefits awaiting you.
- Qlik Community
- :
- All Forums
- :
- QlikView App Dev
- :
- Re: How to get total difference in straight table ...
- Subscribe to RSS Feed
- Mark Topic as New
- Mark Topic as Read
- Float this Topic for Current User
- Bookmark
- Subscribe
- Mute
- Printer Friendly Page
- Mark as New
- Bookmark
- Subscribe
- Mute
- Subscribe to RSS Feed
- Permalink
- Report Inappropriate Content
How to get total difference in straight table against two values in a dimension?
I have a bunch of metrics (left in image below) that I create as expressions and one date dimension (current and previous week) which limits only two dates. How do I get a total/difference column at the end to calculate the difference between the two weeks which is based on a dimension. Column WW is what I want.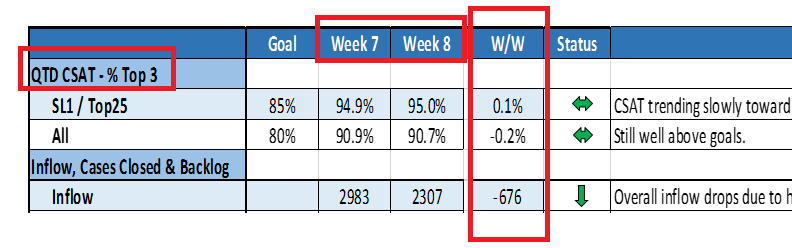
- « Previous Replies
-
- 1
- 2
- Next Replies »
- Mark as New
- Bookmark
- Subscribe
- Mute
- Subscribe to RSS Feed
- Permalink
- Report Inappropriate Content
You can try using the column numbers: Column(3) - Column(2)
Or the expression labels: [Week 8] - [Week 7]
talk is cheap, supply exceeds demand
- Mark as New
- Bookmark
- Subscribe
- Mute
- Subscribe to RSS Feed
- Permalink
- Report Inappropriate Content
Since Week 7 and Week 8 is two values in a dimension, I can't add another column after it to do the calculation. The column on the left where you see "SL1/Top25", "All" and "Inflow" are actual column expression in the straight table. Week is a dimension that has value Week 7 and Week 8. I just transposed the column to row.
- Mark as New
- Bookmark
- Subscribe
- Mute
- Subscribe to RSS Feed
- Permalink
- Report Inappropriate Content
Seems like you're trying to be like Excel and have a different expression for every single cell. That's technically possible, but not something QlikView is good at. In this case, you might add 'W/W' as a dimension value as well, and then pick the correct calculation based on the dimension value, like:
if(Dimension='Goal',goal calculation
,if(left(Dimension,4)='Week',weekly calculation
,if(Dimension='W/W',expression with set analysis to subtract one week from another
,...)))
- Mark as New
- Bookmark
- Subscribe
- Mute
- Subscribe to RSS Feed
- Permalink
- Report Inappropriate Content
Good idea. Let me try that.
- Mark as New
- Bookmark
- Subscribe
- Mute
- Subscribe to RSS Feed
- Permalink
- Report Inappropriate Content
Hi,
I tried this if logic but the difference column is not coming up. 
=
if(Week_Cal_Flag='Previous Week - 1',sum({<Week_Cal_Flag={'Previous Week - 1'}>}CSAT),
if(Week_Cal_Flag='Previous Week',sum({<Week_Cal_Flag={'Previous Week'}>}CSAT),
if(wildmatch(Week_Cal_Flag,'Previous*')>0,sum({<Week_Cal_Flag={'Previous Week'}>}CSAT) - sum({<Week_Cal_Flag={'Previous Week - 1'}>}CSAT)
)))
- Mark as New
- Bookmark
- Subscribe
- Mute
- Subscribe to RSS Feed
- Permalink
- Report Inappropriate Content
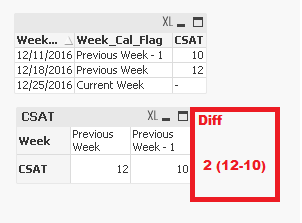
Attached qvw is a sample data where I am playing with the expression calculation. It doesn't seem to show the difference column.
- Mark as New
- Bookmark
- Subscribe
- Mute
- Subscribe to RSS Feed
- Permalink
- Report Inappropriate Content
If your dimension is, say, just [Week Beg Date], and you have 12/11/2016 and 12/18/2016 selected, then that's it, you have two columns. To add another column, you need another value. And you probably don't want to corrupt the [Week Beg Date] field, so you'd want some new dimension linked to it, perhaps.
Wait, we can do better. Something like this.
NewField, Week Beg Date, Sign
12/11/2016, 12/11/2016, +1
12/18/2016, 12/18/2016, +1
W/W, 12/11/2016, -1
W/W, 12/18/2016, +1
Then a much simpler expression will work.
Dimension = NewField
Expression = sum(CSAT * Sign)
But the exact table you need and exact values you need are going to depend a lot on your data model and how your user is going to be selecting values, or how else you're determining which two weeks to show. The idea, though, is to handle the complexity with data to the extent possible.
- Mark as New
- Bookmark
- Subscribe
- Mute
- Subscribe to RSS Feed
- Permalink
- Report Inappropriate Content
OK, I can get this working. I'll be back shortly.
- Mark as New
- Bookmark
- Subscribe
- Mute
- Subscribe to RSS Feed
- Permalink
- Report Inappropriate Content
OK, here's an example of what I'm talking about. I changed all the script to match up to my suggested new table and expression, but I think it's essentially the same data model, just with that extra bit controlling the chart.
- « Previous Replies
-
- 1
- 2
- Next Replies »