Unlock a world of possibilities! Login now and discover the exclusive benefits awaiting you.
- Qlik Community
- :
- All Forums
- :
- QlikView App Dev
- :
- How to show 4 expressions in 2 lines using subtype...
- Subscribe to RSS Feed
- Mark Topic as New
- Mark Topic as Read
- Float this Topic for Current User
- Bookmark
- Subscribe
- Mute
- Printer Friendly Page
- Mark as New
- Bookmark
- Subscribe
- Mute
- Subscribe to RSS Feed
- Permalink
- Report Inappropriate Content
How to show 4 expressions in 2 lines using subtype stacked ?
hello everybody ,
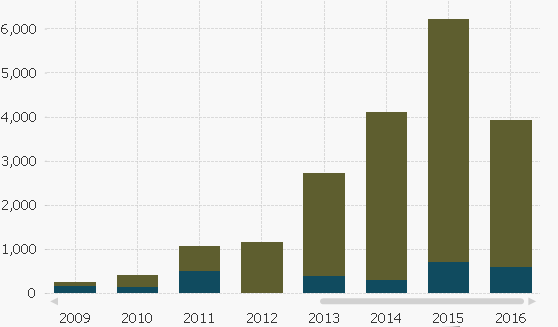
we ha a bar chart with 2 expressions : brutto , netto and dim year , subtype=stacked , look like :
we need to show brutto , netto in 2 different calculations that give us 4 expressions , so there is a line for each , something like this :
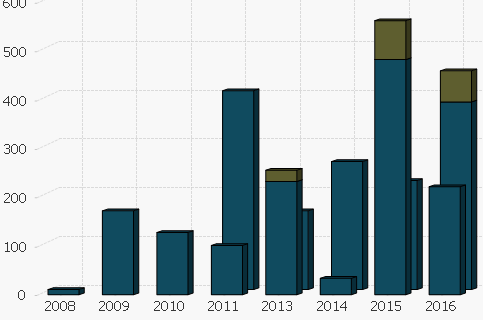
i am sure there is awy to do it , can you help ? thanks!!
Accepted Solutions
- Mark as New
- Bookmark
- Subscribe
- Mute
- Subscribe to RSS Feed
- Permalink
- Report Inappropriate Content
Awesome, it is much easier to work with data that makes sense 
Does this work for you?
- Mark as New
- Bookmark
- Subscribe
- Mute
- Subscribe to RSS Feed
- Permalink
- Report Inappropriate Content
You can try combo chart with one expression is bar and one more is line. Or else if you are referring different then use style is static instead of group
- Mark as New
- Bookmark
- Subscribe
- Mute
- Subscribe to RSS Feed
- Permalink
- Report Inappropriate Content
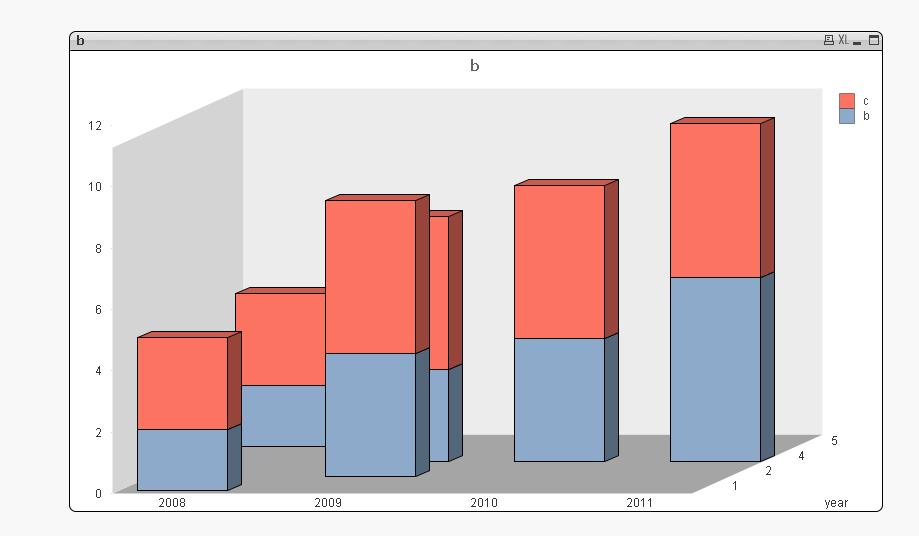
Like this?
- Mark as New
- Bookmark
- Subscribe
- Mute
- Subscribe to RSS Feed
- Permalink
- Report Inappropriate Content
hi Adam , not exactly , because i have only one dimension , and to be more cleare 4 ( not 2 ) expressions , brutto , netto calc type 1 and brutto , netto calc type 2. sorry for not writing this before.
- Mark as New
- Bookmark
- Subscribe
- Mute
- Subscribe to RSS Feed
- Permalink
- Report Inappropriate Content
hmmmm can you share some simple data in excel or a qvw? sorry my brain isn't up to speed today!
- Mark as New
- Bookmark
- Subscribe
- Mute
- Subscribe to RSS Feed
- Permalink
- Report Inappropriate Content
Did you manage to solve this one?
- Mark as New
- Bookmark
- Subscribe
- Mute
- Subscribe to RSS Feed
- Permalink
- Report Inappropriate Content
hi , here an example of 1 dim and 4 expr ,
i need brutto_1 & netto_1 stacked in one line , and brutto_2 & netto_2 stacked in anothet line ,
thanks !
- Mark as New
- Bookmark
- Subscribe
- Mute
- Subscribe to RSS Feed
- Permalink
- Report Inappropriate Content
Awesome, it is much easier to work with data that makes sense
Does this work for you?
- Mark as New
- Bookmark
- Subscribe
- Mute
- Subscribe to RSS Feed
- Permalink
- Report Inappropriate Content
great help Adam - thanks !!
- Mark as New
- Bookmark
- Subscribe
- Mute
- Subscribe to RSS Feed
- Permalink
- Report Inappropriate Content
No worries at all
If your real world data is more complicated then use Pick(match()) instead of IF as it will work faster, but in this case it will work.