Unlock a world of possibilities! Login now and discover the exclusive benefits awaiting you.
- Qlik Community
- :
- All Forums
- :
- QlikView App Dev
- :
- Is it possible at all to get a summary table?
- Subscribe to RSS Feed
- Mark Topic as New
- Mark Topic as Read
- Float this Topic for Current User
- Bookmark
- Subscribe
- Mute
- Printer Friendly Page
- Mark as New
- Bookmark
- Subscribe
- Mute
- Subscribe to RSS Feed
- Permalink
- Report Inappropriate Content
Is it possible at all to get a summary table?
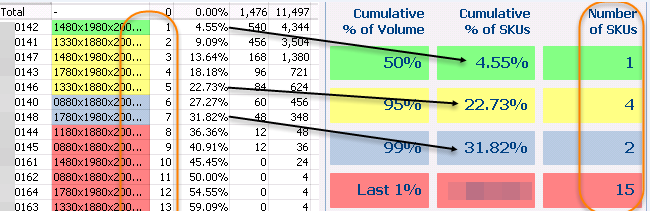
Hi, I need to move this Excel solution into QV and make it dynamic. I got details but do not know how to get the summary table if at all possible. This is part of a general sales analysis QV app.
Issues:
1. Get the last cumulative % for each class (marked with black arrows)
2. Get the count of items by class (marked in orange circle)
If the initial idea is not doable to get these totals by class in the details table can also be solution.
Any idea is welcome. Thanks in advance
- « Previous Replies
-
- 1
- 2
- Next Replies »
Accepted Solutions
- Mark as New
- Bookmark
- Subscribe
- Mute
- Subscribe to RSS Feed
- Permalink
- Report Inappropriate Content
I was inspired today and once more answered my own question  .
.
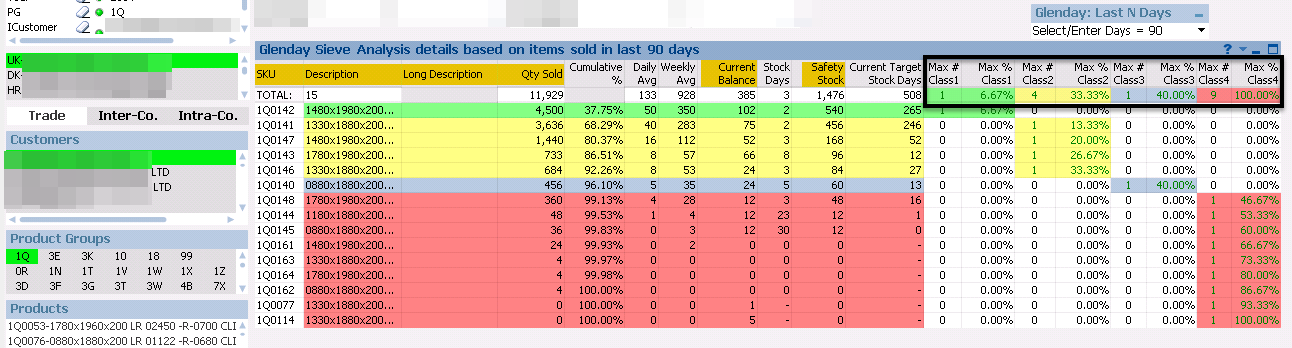
The needed totals by Class are shown in the TOTAL line above 8 extra columns added to be able to get those max items and max percentages.This is the best I can get to satisfy all requests and retain it dynamic with no extra fields in the data model. Only columns marked in orange exist in the data model used in this table.
Thanks to everyone who tried to help me out as any idea is helpful.
- Mark as New
- Bookmark
- Subscribe
- Mute
- Subscribe to RSS Feed
- Permalink
- Report Inappropriate Content
You need a dimension for this which contained the logic from the colors. Then you could use these dimension in a table-chart and the expression will be depend from your raw-data.
- Marcus
- Mark as New
- Bookmark
- Subscribe
- Mute
- Subscribe to RSS Feed
- Permalink
- Report Inappropriate Content
Does your Data model contain the Product Classes?
- Mark as New
- Bookmark
- Subscribe
- Mute
- Subscribe to RSS Feed
- Permalink
- Report Inappropriate Content
Do you mean something like the attached
- Mark as New
- Bookmark
- Subscribe
- Mute
- Subscribe to RSS Feed
- Permalink
- Report Inappropriate Content
Of course man visit different demo dashboard at Qlik website.
It is possible to design and develop summary tab.
Just you need to design your data model as per the same .
- Mark as New
- Bookmark
- Subscribe
- Mute
- Subscribe to RSS Feed
- Permalink
- Report Inappropriate Content
Thx. Just a small clarification the picture in my initial question is from QV and not Excel.
I do not have Class stored in my data model as this depends on the selection user makes. A user can select different days for sold in last N days, different product groups, customers, etc.
@Alan: This would work if I have the Class in the data model, but I have it only in the pivot table and it is dynamic as described earlier.
- Mark as New
- Bookmark
- Subscribe
- Mute
- Subscribe to RSS Feed
- Permalink
- Report Inappropriate Content
You missed the point here. If interested please take a look into my last reply. Thx
- Mark as New
- Bookmark
- Subscribe
- Mute
- Subscribe to RSS Feed
- Permalink
- Report Inappropriate Content
You could create the Class in the Script with a Nested IF statement based on the Product Codes
- Mark as New
- Bookmark
- Subscribe
- Mute
- Subscribe to RSS Feed
- Permalink
- Report Inappropriate Content
Something like this for the Nested IF
IF(Code = 0146, 'CLASSA',
IF(Code = 0142, 'CLASSB',
IF(Code = 0141, 'CLASSB'))) as ClassTest
- Mark as New
- Bookmark
- Subscribe
- Mute
- Subscribe to RSS Feed
- Permalink
- Report Inappropriate Content
Sorry Alan, but the Class gets calculated dynamically with tens of selections before and then by calculating qty sold in x number of days where x can be anything. This is impossible to calculate in the script
Thanks anyway
- « Previous Replies
-
- 1
- 2
- Next Replies »