Unlock a world of possibilities! Login now and discover the exclusive benefits awaiting you.
- Qlik Community
- :
- All Forums
- :
- QlikView App Dev
- :
- Re: Last 6 month Average on day level data
- Subscribe to RSS Feed
- Mark Topic as New
- Mark Topic as Read
- Float this Topic for Current User
- Bookmark
- Subscribe
- Mute
- Printer Friendly Page
- Mark as New
- Bookmark
- Subscribe
- Mute
- Subscribe to RSS Feed
- Permalink
- Report Inappropriate Content
Last 6 month Average on day level data
Hi All,
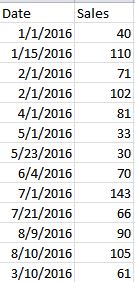
I have a day level data and need to show the last 6 month average in a table.
I have the data as follows,
Need the output in the following format,
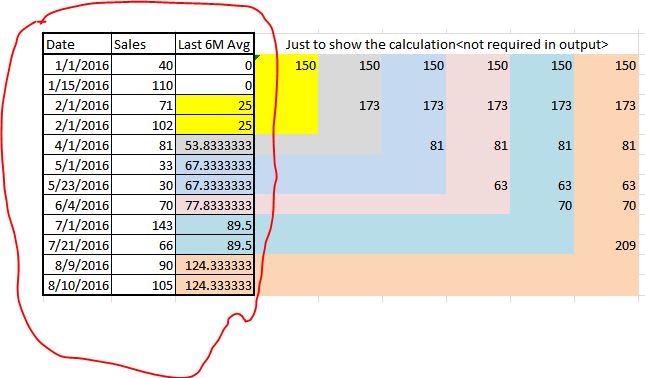
Calculation logic --> (sum of last 6 months sales)/6 (exclude current month data)
Some one who can show how this can be implemented in table chart will be lot of help.
Thanks in advance. I have attached the data in excel sheet for your convenience.
- Mark as New
- Bookmark
- Subscribe
- Mute
- Subscribe to RSS Feed
- Permalink
- Report Inappropriate Content
Perhaps this
Sum({<Month = {"=$(=AddMonths(max(Month(Datefield))),-6)"}>} Sales) / Count ({<Month = {"=$(=AddMonths(max(Month(Datefield))),-6)"}>} Sales)
- Mark as New
- Bookmark
- Subscribe
- Mute
- Subscribe to RSS Feed
- Permalink
- Report Inappropriate Content
Do you have gaps in your dates or is this how your data is laid out? May be use The As-Of Table