Unlock a world of possibilities! Login now and discover the exclusive benefits awaiting you.
- Qlik Community
- :
- All Forums
- :
- QlikView App Dev
- :
- Re: Pivottable to diagram (rangesum)
- Subscribe to RSS Feed
- Mark Topic as New
- Mark Topic as Read
- Float this Topic for Current User
- Bookmark
- Subscribe
- Mute
- Printer Friendly Page
- Mark as New
- Bookmark
- Subscribe
- Mute
- Subscribe to RSS Feed
- Permalink
- Report Inappropriate Content
Pivottable to diagram (rangesum)
Hello,
I have two problems with the visualization of a forecast - diagram.
The first one:
In the pivottable everything is correctly. Here I'm using following formel:
Rangesum(Before($(vAVG)/10 ,0,ColumnNo())))
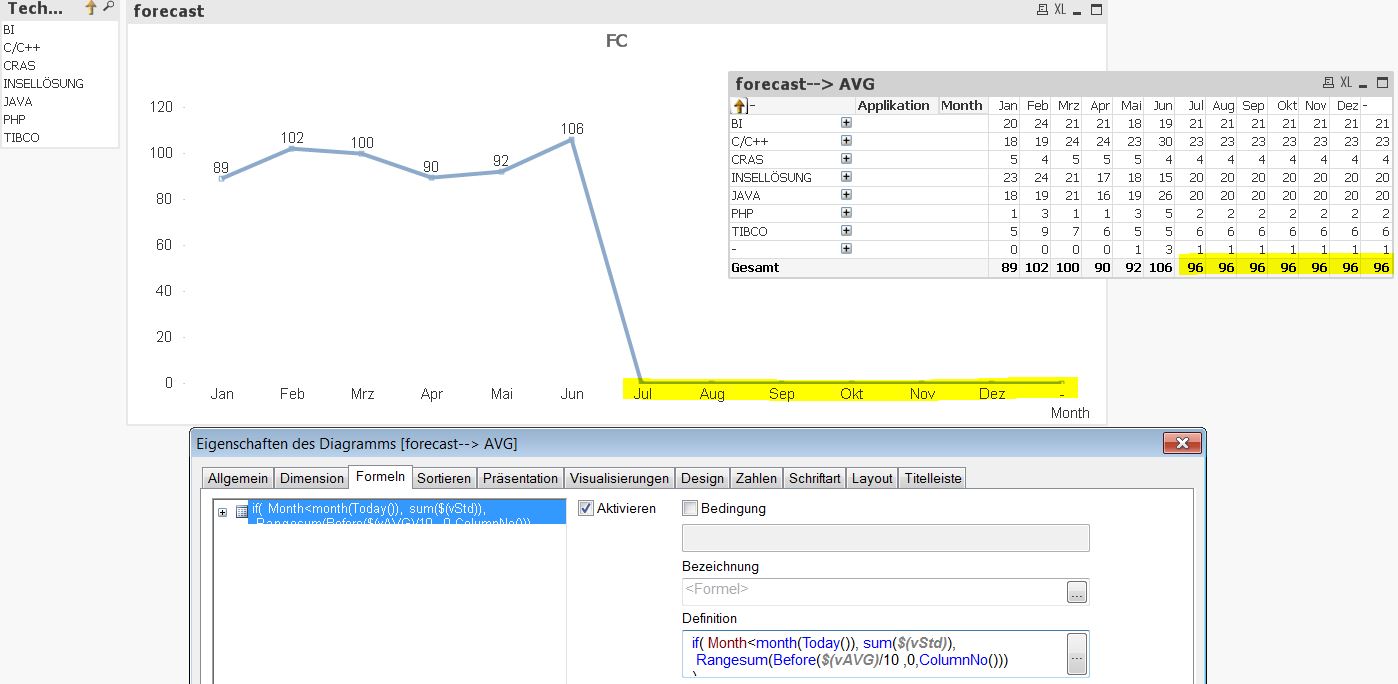
In the diagram I'm using this formel and it shows me only the exist months:
if( Month<month(Today()), sum( $(vStd)),
Rangesum(Before($(vAVG) ,0,ColumnNo()))
)
The second problem, if I set the filter on Technology, for example "BI", then I get no values for the future month in diagram and also pivottable.
Can you please help me.
- « Previous Replies
-
- 1
- 2
- Next Replies »
Accepted Solutions
- Mark as New
- Bookmark
- Subscribe
- Mute
- Subscribe to RSS Feed
- Permalink
- Report Inappropriate Content
Try this expression out:
If(Month < Month(Today()),
Sum($(vStd)),
Rangesum(Above($(vAVG) , 0, RowNo())) + Avg({1}0)
)
- Mark as New
- Bookmark
- Subscribe
- Mute
- Subscribe to RSS Feed
- Permalink
- Report Inappropriate Content
How is vStd defined here? Would you be able to share a sample?
- Mark as New
- Bookmark
- Subscribe
- Mute
- Subscribe to RSS Feed
- Permalink
- Report Inappropriate Content
Hi Sunny, vStd is defined: Std/($(vShowHour)) and $(vShowHour) as number
- Mark as New
- Bookmark
- Subscribe
- Mute
- Subscribe to RSS Feed
- Permalink
- Report Inappropriate Content
Just out of curiosity, what do you get when you use this:
Sum($(vStd))
- Mark as New
- Bookmark
- Subscribe
- Mute
- Subscribe to RSS Feed
- Permalink
- Report Inappropriate Content
If I do it in the formel of diagram, this diagram doesn't change anything. See the screenshot.
If I give this formel Sum($(vStd))in the textbox, then I get the whole amount -> correct.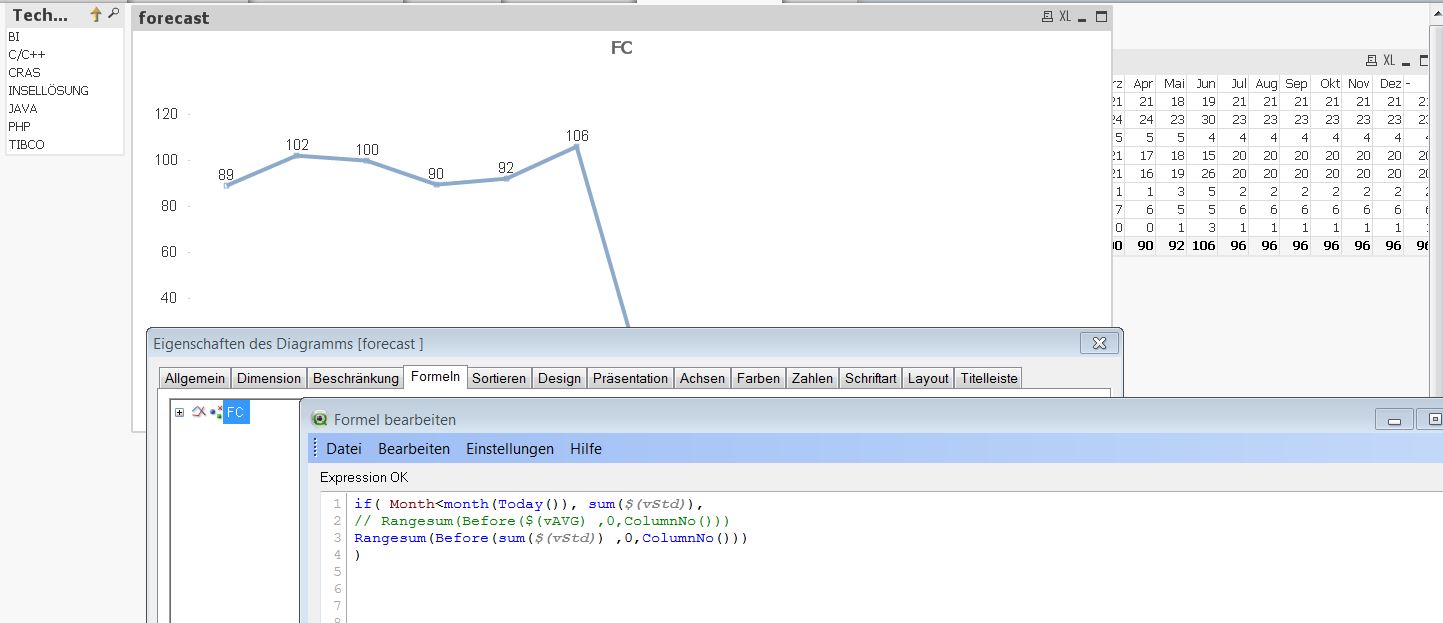
- Mark as New
- Bookmark
- Subscribe
- Mute
- Subscribe to RSS Feed
- Permalink
- Report Inappropriate Content
Would you be able to share a sample to look at?
Preparing examples for Upload - Reduction and Data Scrambling
- Mark as New
- Bookmark
- Subscribe
- Mute
- Subscribe to RSS Feed
- Permalink
- Report Inappropriate Content
Hi Sunny,
sorry for my delayed reply. I attached the QV sample. Please look on this.
How I have to handle formel in diagram ?
and why if I select an application, then I get no values shown for the FC month in diagram and also in the table?
- Mark as New
- Bookmark
- Subscribe
- Mute
- Subscribe to RSS Feed
- Permalink
- Report Inappropriate Content
Try this expression out:
If(Month < Month(Today()),
Sum($(vStd)),
Rangesum(Above($(vAVG) , 0, RowNo())) + Avg({1}0)
)
- Mark as New
- Bookmark
- Subscribe
- Mute
- Subscribe to RSS Feed
- Permalink
- Report Inappropriate Content
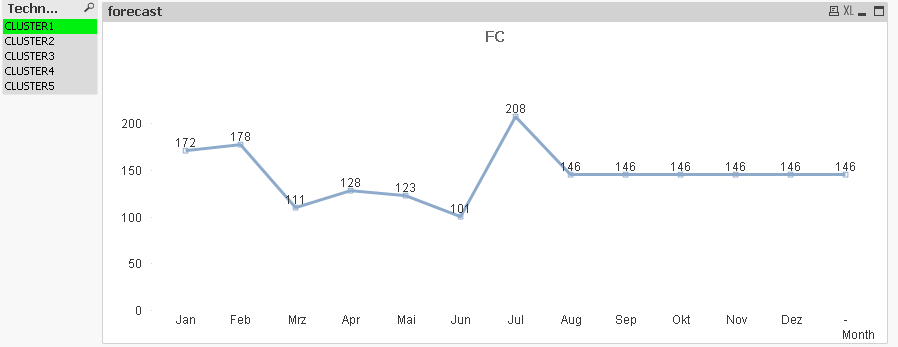
many Thanks! It works! Can you please explain me this : Avg({1}0) If I want to have total sum of the month, I can use also this formel. I need only click in the diagram on the "accumulation" Jan = 172 Feb = 172 +178 Mrz = 172+178+111 ...
- Mark as New
- Bookmark
- Subscribe
- Mute
- Subscribe to RSS Feed
- Permalink
- Report Inappropriate Content
Avg({1}0) allows us to keep the forecasted area of the chart disallowing any selection made to that part due to {1}.
Is the accumulation part sorted out? or is that a question for me?
Also, Once you get to what you want, I would ask you to close this thread down by marking correct and helpful responses so that other people coming to this thread in future can look for answers in the correct and helpful responses.
Qlik Community Tip: Marking Replies as Correct or Helpful
Best,
Sunny
- « Previous Replies
-
- 1
- 2
- Next Replies »