Unlock a world of possibilities! Login now and discover the exclusive benefits awaiting you.
- Qlik Community
- :
- All Forums
- :
- QlikView App Dev
- :
- Re: Plan vs Actual
- Subscribe to RSS Feed
- Mark Topic as New
- Mark Topic as Read
- Float this Topic for Current User
- Bookmark
- Subscribe
- Mute
- Printer Friendly Page
- Mark as New
- Bookmark
- Subscribe
- Mute
- Subscribe to RSS Feed
- Permalink
- Report Inappropriate Content
Plan vs Actual
Good day all,
I need help,
I have a table with plan and actual...
I need to build a chart with the plan represented in a linechart while the actual in a bar chart (in the same plot)
Please find attached file for clarity. Thanks in advance
Regards
- « Previous Replies
-
- 1
- 2
- Next Replies »
- Mark as New
- Bookmark
- Subscribe
- Mute
- Subscribe to RSS Feed
- Permalink
- Report Inappropriate Content
Hi ,
Refter this
Vikas
If the issue is solved please mark the answer with Accept as Solution & like it.
If you want to go quickly, go alone. If you want to go far, go together.
- Mark as New
- Bookmark
- Subscribe
- Mute
- Subscribe to RSS Feed
- Permalink
- Report Inappropriate Content
Refer this too
https://community.qlik.com/thread/185897
Vikas
If the issue is solved please mark the answer with Accept as Solution & like it.
If you want to go quickly, go alone. If you want to go far, go together.
- Mark as New
- Bookmark
- Subscribe
- Mute
- Subscribe to RSS Feed
- Permalink
- Report Inappropriate Content
Hello Akpofure
You can use a combo chart . However your plan and actual are available as values of field.
KIndly find attached application if it resembles something u need??
!
Thanks & Regards
Chintan
- Mark as New
- Bookmark
- Subscribe
- Mute
- Subscribe to RSS Feed
- Permalink
- Report Inappropriate Content
You can create Combo chart
Plan is line Chart and Actual is Bar Chart
For Ref, PFA
- Mark as New
- Bookmark
- Subscribe
- Mute
- Subscribe to RSS Feed
- Permalink
- Report Inappropriate Content
Combo chart
- Mark as New
- Bookmark
- Subscribe
- Mute
- Subscribe to RSS Feed
- Permalink
- Report Inappropriate Content
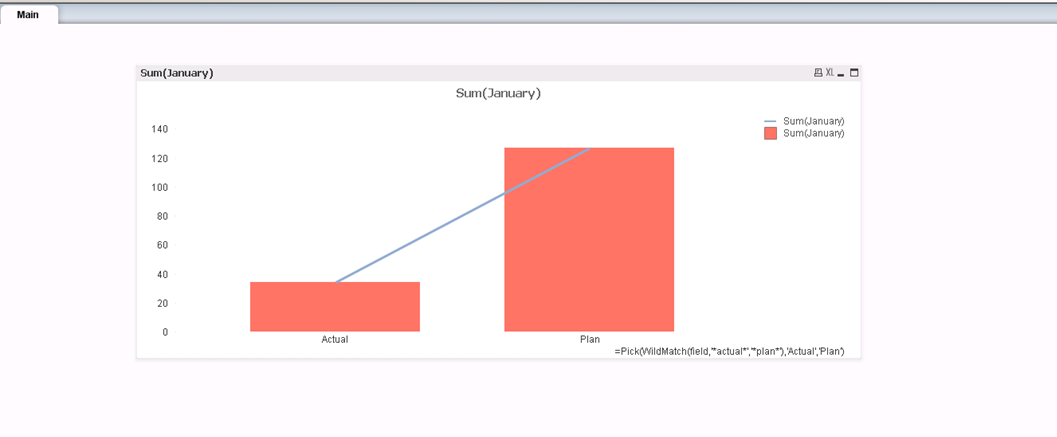
If you do not have flag to filter Atual and plan in ur data create calucualted dim like i did chart and take combo chart and one exp for Bar and another one for Line.
I hope this may helps you.
-Nagarjun
- Mark as New
- Bookmark
- Subscribe
- Mute
- Subscribe to RSS Feed
- Permalink
- Report Inappropriate Content
Thanks for your response, the above design... Won't be great since I want the dimension to be Benin, Jos and not actual and plan...
Thanks..
Can that be achieved?
- Mark as New
- Bookmark
- Subscribe
- Mute
- Subscribe to RSS Feed
- Permalink
- Report Inappropriate Content
Thanks for your response, . Won't be great since I want the dimension to be Benin, Jos and not actual and plan...
Thanks..
Can that be achieved?
- Mark as New
- Bookmark
- Subscribe
- Mute
- Subscribe to RSS Feed
- Permalink
- Report Inappropriate Content
Can share what is your expected output?
That would be helpful 
-Nagarjun
- « Previous Replies
-
- 1
- 2
- Next Replies »