Unlock a world of possibilities! Login now and discover the exclusive benefits awaiting you.
- Qlik Community
- :
- All Forums
- :
- QlikView App Dev
- :
- Re: Question aggregate
- Subscribe to RSS Feed
- Mark Topic as New
- Mark Topic as Read
- Float this Topic for Current User
- Bookmark
- Subscribe
- Mute
- Printer Friendly Page
- Mark as New
- Bookmark
- Subscribe
- Mute
- Subscribe to RSS Feed
- Permalink
- Report Inappropriate Content
Question aggregate
Hi guys, if I have a table like this :
| Date | Number |
| 20/01/2012 | 2 |
| 20/02/2012 | 2 |
| 20/03/2012 | 1 |
| 20/04/2012 | 3 |
| 20/05/2012 | 1 |
| 20/06/2012 | 1 |
How could I get a table like this with set analysis ?
| Date | Number |
| 20/01/2012 | 0 |
| 20/02/2012 | 0 |
| 20/03/2012 | 0 |
| 20/04/2012 | 0 |
| 20/05/2012 | 0 |
| 20/06/2012 | 10 |
Regards, Marcel.
- « Previous Replies
-
- 1
- 2
- Next Replies »
- Mark as New
- Bookmark
- Subscribe
- Mute
- Subscribe to RSS Feed
- Permalink
- Report Inappropriate Content
Hi Marcel,
PFA my solution... hope this helps!
Regards.
- Mark as New
- Bookmark
- Subscribe
- Mute
- Subscribe to RSS Feed
- Permalink
- Report Inappropriate Content
Thanks Salto! That do the work, but I'd love to do it with set analysis because this is a dummy test, but in my case I'm talking about millions of rows, and in the last row of "number", you have to put the sum of all the related values above.
I think it should be withh aggr, because there's no only a "date" field to consider, it has to consider 5 fields more.
Regards, Marcel.
- Mark as New
- Bookmark
- Subscribe
- Mute
- Subscribe to RSS Feed
- Permalink
- Report Inappropriate Content
Hi Guys,
Just a little change to get total on June not on April
best regards
Chris
- Mark as New
- Bookmark
- Subscribe
- Mute
- Subscribe to RSS Feed
- Permalink
- Report Inappropriate Content
This is my real case :
| Date | ID | Total Value | Number |
| 11/03/2009 | R041060 | 40,25 | 1 |
| 24/08/2009 | R041060 | 74,07 | 1 |
| 05/08/2010 | R041060 | 289,02 | 1 |
| 20/08/2010 | R041060 | 89,93 | 1 |
And my desired result would be :
| Date | ID | Total New | Number New |
| 11/03/2009 | R041060 | 0 | 0 |
| 24/08/2009 | R041060 | 0 | 0 |
| 05/08/2010 | R041060 | 0 | 0 |
| 20/08/2010 | R041060 | 493,27 | 4 |
- Mark as New
- Bookmark
- Subscribe
- Mute
- Subscribe to RSS Feed
- Permalink
- Report Inappropriate Content
Hi,
I have tried with
=aggr(sum(TotalValue),ID)
and
=aggr(count(total Number),ID)
but the result is not exactly what we are looking for... sorry about that,
- Mark as New
- Bookmark
- Subscribe
- Mute
- Subscribe to RSS Feed
- Permalink
- Report Inappropriate Content
Thanks Salto for the try! I know this is not that easy.
My proper example of what I'm looking for would be :
This is my current table :
| Date | ID | Total Value | Number |
| 11/03/2009 | R041060 | 40,25 | 1 |
| 24/08/2009 | R041060 | 74,07 | 1 |
| 05/08/2010 | R041060 | 289,02 | 1 |
| 20/08/2010 | R041060 | 89,93 | 1 |
| 12/03/2009 | R041065 | 50,25 | 1 |
| 25/08/2009 | R041065 | 84,07 | 1 |
| 07/08/2010 | R041065 | 389,02 | 1 |
| 22/08/2010 | R041065 | 99,93 | 1 |
This is my desired table :
| Date | ID | Total Value | Number |
| 11/03/2009 | R041060 | 0 | 0 |
| 24/08/2009 | R041060 | 0 | 0 |
| 05/08/2010 | R041060 | 0 | 0 |
| 20/08/2010 | R041060 | 493,27 | 4 |
| 12/03/2009 | R041065 | 0 | 0 |
| 25/08/2009 | R041065 | 0 | 0 |
| 07/08/2010 | R041065 | 0 | 0 |
| 22/08/2010 | R041065 | 623,27 | 4 |
Anybody knows how to make it?
Regards, Marcel.
- Mark as New
- Bookmark
- Subscribe
- Mute
- Subscribe to RSS Feed
- Permalink
- Report Inappropriate Content
see attached document.
calculation as below :
If(
MaxString(ID)
<>
below(Total ID)
,
Sum(Total<ID>[Total Value]),' ')
- Mark as New
- Bookmark
- Subscribe
- Mute
- Subscribe to RSS Feed
- Permalink
- Report Inappropriate Content
Try this
variable
FromDate= =max(DATE)
ToDate= =min(DATE)
EXpression
aggr( RangeSum(above(sum({<DATE={">=$(ToDate) <=$(FromDate)"}>}Sales),0,RowNo())),DATE)
- Mark as New
- Bookmark
- Subscribe
- Mute
- Subscribe to RSS Feed
- Permalink
- Report Inappropriate Content
Thanks for the try Mohit!
The min and max Date has to be dinamically, because it depends on more than one field which is the maximum date per ID.
And in the total row will get the same total result as a regular sum.
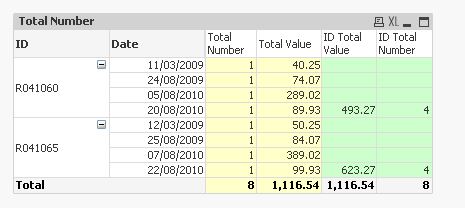
Here is what I'm trying to get :
| Date | ID | Total Value | Number |
| 11/03/2009 | R041060 | 0 | 0 |
| 24/08/2009 | R041060 | 0 | 0 |
| 05/08/2010 | R041060 | 0 | 0 |
| 20/08/2010 | R041060 | 493,27 | 4 |
| 12/03/2009 | R041065 | 0 | 0 |
| 25/08/2009 | R041065 | 0 | 0 |
| 07/08/2010 | R041065 | 0 | 0 |
| 22/08/2010 | R041065 | 623,27 | 4 |
| Total | 1116,54 | 8 |
- « Previous Replies
-
- 1
- 2
- Next Replies »