Unlock a world of possibilities! Login now and discover the exclusive benefits awaiting you.
- Qlik Community
- :
- All Forums
- :
- QlikView App Dev
- :
- Re: Replacing numbers with text on the y-axis of a...
- Subscribe to RSS Feed
- Mark Topic as New
- Mark Topic as Read
- Float this Topic for Current User
- Bookmark
- Subscribe
- Mute
- Printer Friendly Page
- Mark as New
- Bookmark
- Subscribe
- Mute
- Subscribe to RSS Feed
- Permalink
- Report Inappropriate Content
Replacing numbers with text on the y-axis of a bar chart
Hi
I have a bar chart which currently shows the numeric values we have assigned to specific grades of staff - however, I want to change this so that the y-axis shows the grade title of the staff rather than the grade value which we have created.
I entered the following in the Load Script but can't seem to be able to change the y-axis to the titles.
REPLACE LOAD
dual(Text,Number) as Grade
INLINE [
Text,Number
Partner,10
Director,9
Senior Manager,8
Manager,7
Senior Associate 3,6
Senior Associate 2,5
Senior Associate 1,4
Associate 2,3
Associate 1,2
Support,1
];
Not sure what the issue is. Any help would be appreciated. I summarise the titles and values below.
Value - Title
10 - Partner
9- Director
8 -Senior Manager
7- Manager
6- Senior Associate 3
5 - Senior Associate 2
4- Senior Associate 1
3- Associate 2
2- Associate 1
1- Support,
- Mark as New
- Bookmark
- Subscribe
- Mute
- Subscribe to RSS Feed
- Permalink
- Report Inappropriate Content
As far as I know what you want is not possible. The values on the y-axis cannot be mapped to string values.
talk is cheap, supply exceeds demand
- Mark as New
- Bookmark
- Subscribe
- Mute
- Subscribe to RSS Feed
- Permalink
- Report Inappropriate Content
Can't you simply use the Title field as chart dimension?
- Mark as New
- Bookmark
- Subscribe
- Mute
- Subscribe to RSS Feed
- Permalink
- Report Inappropriate Content
No I have something else as the dimension.
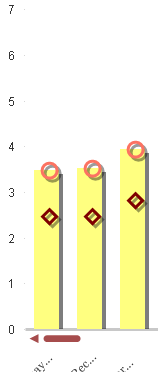
In place of the digits on the y-axis, I want to have grades Support > Associate 1 > Associate 2 etc.