Unlock a world of possibilities! Login now and discover the exclusive benefits awaiting you.
- Qlik Community
- :
- All Forums
- :
- QlikView App Dev
- :
- Re: Scatter Chart Map
- Subscribe to RSS Feed
- Mark Topic as New
- Mark Topic as Read
- Float this Topic for Current User
- Bookmark
- Subscribe
- Mute
- Printer Friendly Page
- Mark as New
- Bookmark
- Subscribe
- Mute
- Subscribe to RSS Feed
- Permalink
- Report Inappropriate Content
Scatter Chart Map
Hello,
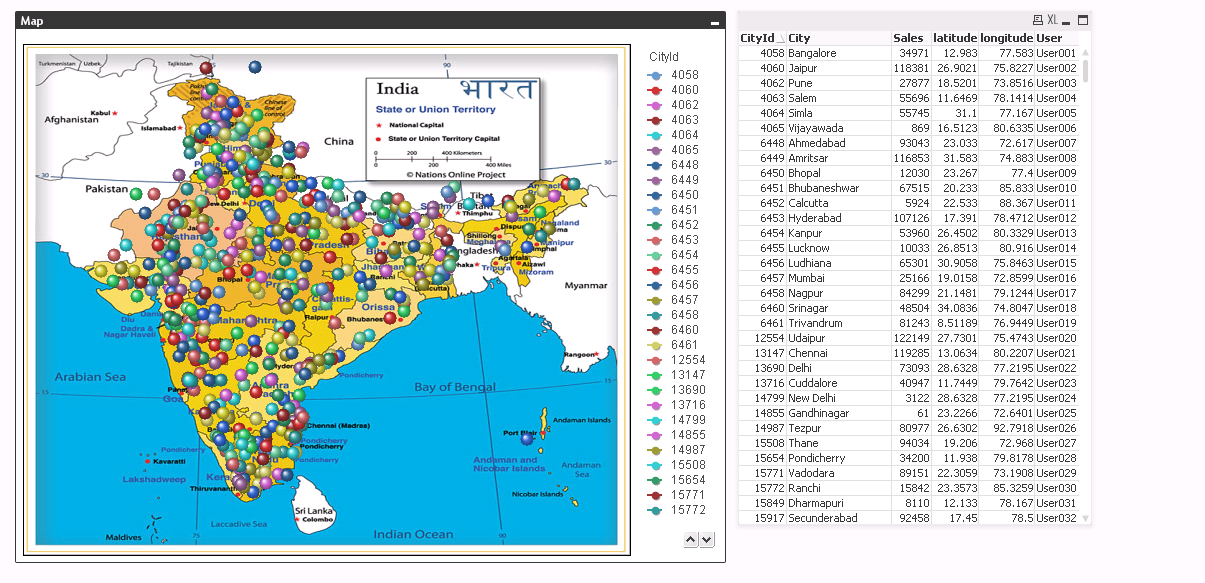
I have a Scatter Chart as a Map (see attached QVW).

The thing is I need the following: I don't want to see all city bubbles on the first place. I need to show only the corresponding bubble for the user who logs in, by using function OsUser() where in my company I get UserXXX:

Do you know how to do this? That when I open the app show only the bubble associated to my City?
Thanks!
- Mark as New
- Bookmark
- Subscribe
- Mute
- Subscribe to RSS Feed
- Permalink
- Report Inappropriate Content
HI,
Use section access to reduce the data according to the user login.
In this way only the cities will be shown to which user is associated to.
If you need sample , then please update the cities with the user names associated.
Will provide you the sample
Regards
Nitin
- Mark as New
- Bookmark
- Subscribe
- Mute
- Subscribe to RSS Feed
- Permalink
- Report Inappropriate Content
1) Still Confused, Here what do you want. You have Total 571 City's. So while open the Doc what you want to Achieve?
2) So, If you adjust width and Height might be it will come and meantime, Here you are using same cities from different States. Then fix the Good fit then try might be it will come.
I am not sure..
- Mark as New
- Bookmark
- Subscribe
- Mute
- Subscribe to RSS Feed
- Permalink
- Report Inappropriate Content
The thing is that I don't want to reduce all the data for a specific City. I need to show all the data for all users.
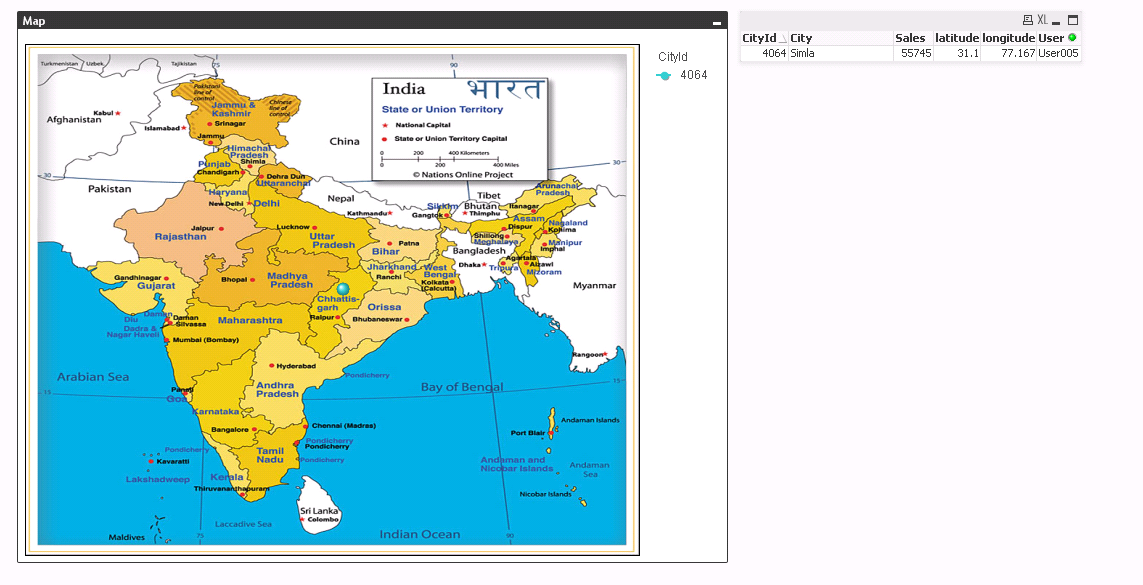
The only issue I need to solve is with the map. Let's say you're User005. Then when I open the app it should show only the bubble for User005, but still showing the all the data for the rest of the app...
- Mark as New
- Bookmark
- Subscribe
- Mute
- Subscribe to RSS Feed
- Permalink
- Report Inappropriate Content
HI ,
Please create a variable vUser as
=subfield(OSUser(),'\',2)
in the map expressions of latitude and longitude
add set analysis state ment as
{<User={$(=vUser)}>}
It will work
Nitin
- Mark as New
- Bookmark
- Subscribe
- Mute
- Subscribe to RSS Feed
- Permalink
- Report Inappropriate Content
If you don't have too many users maybe you could use Set Analysis or a nested if in the measure for that map that would limit the city to the user.
You might also need to create an inline table with the userid and the city they can see in combination with the Set Analysis.
Not sure that will work.
- Mark as New
- Bookmark
- Subscribe
- Mute
- Subscribe to RSS Feed
- Permalink
- Report Inappropriate Content
Hello, I tried that for a specific user (User005):
Longitude:
=SUM({<User={'User005'}>}round (256*pow(2,($(var_zoom)-1)))+( longitude *((256*pow(2,$(var_zoom)))/360)) )
Latitude:
=SUM({<User={'User005'}>}((256*pow(2,($(var_zoom)-1)))+((0.5*log((1+(sin((latitude)*pi()/180)))/(1-(sin((latitude)*pi()/180)))))*((-256*pow(2,$(var_zoom)))/(2*pi())))))
But it doesn't work. Do you know what could it be?
I attach the QVW. Any idea? Thanks!
- Mark as New
- Bookmark
- Subscribe
- Mute
- Subscribe to RSS Feed
- Permalink
- Report Inappropriate Content
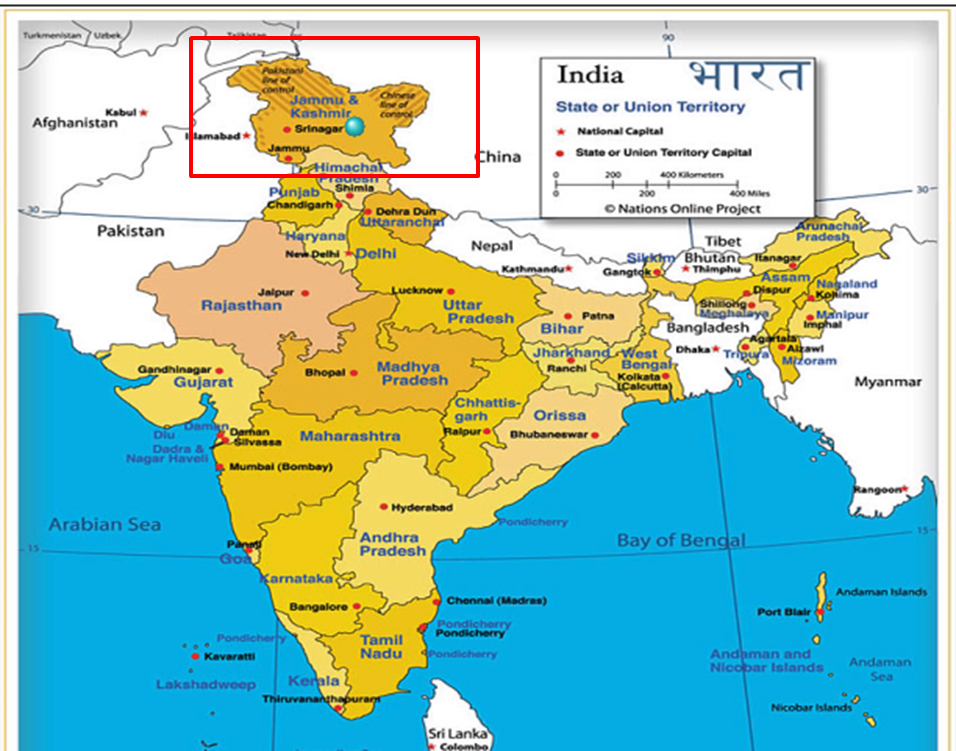
Hi Its working,
The screen shot is from your sample app only.
Is this not what you require

- Mark as New
- Bookmark
- Subscribe
- Mute
- Subscribe to RSS Feed
- Permalink
- Report Inappropriate Content
Hi micro win,
I know your post started in Jul/2016 and I'm here just starting to understand and learn how to plot geolocation
information on a map. I downloaded your sample that you attached in your original post. I have looked at this a few times now. How did you get the map (in this case, India) to show up on your screen? I think I can pretty much follow the code inside your QVW file but can't seem to find how you display the map.
Thanks
- Mark as New
- Bookmark
- Subscribe
- Mute
- Subscribe to RSS Feed
- Permalink
- Report Inappropriate Content
Also what was the purpose of the TextBox (TX01) which contains the Google URL? Is it actually being used in your document?