Unlock a world of possibilities! Login now and discover the exclusive benefits awaiting you.
- Qlik Community
- :
- All Forums
- :
- QlikView App Dev
- :
- Re: Show values of month and accumulated at the sa...
- Subscribe to RSS Feed
- Mark Topic as New
- Mark Topic as Read
- Float this Topic for Current User
- Bookmark
- Subscribe
- Mute
- Printer Friendly Page
- Mark as New
- Bookmark
- Subscribe
- Mute
- Subscribe to RSS Feed
- Permalink
- Report Inappropriate Content
Show values of month and accumulated at the same time
Hi community,
I have a problem. I need create a bars char where show quantity of distinct IDs and accumulated from January to current month.
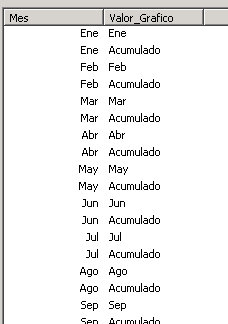
I create a new dimension Valor_Grafico (dimension that show in char) linking with Calendar through field "Mes":
My expression is from the two cases:
If (Valor_Grafico<>'Acumulado',
sum(aggr(count(DISTINCT {<[Tipo Fecha]={$(vTipoFecha)}, Foto = {'Publicación anual'}, CASO_VALOR_ACTUAL={4}, ESSO_ID_ESTADO*={3,4}>} SOLI_ID_SOLICITUD)
+
count(DISTINCT {<[Tipo Fecha]={$(vTipoFecha)}, Foto = {'Publicación anual'}, ESSO_ID_ESTADO*={3,4}, SOLI_ID_SOLICITUD*=E({<ESSO_ID_ESTADO*={3,4}, [Transición sin precedente]=, [Tipo Fecha]={$(vTipoFecha)},
Foto = {'Publicación anual'},CASO_VALOR_ACTUAL={4}>}SOLI_ID_SOLICITUD)>} SOLI_ID_SOLICITUD), [Transición sin precedente],Año))
,
sum(aggr(count(DISTINCT {<[Tipo Fecha]={$(vTipoFecha)}, Foto = {'Publicación anual'}, Mes={"<=$(=max(Mes))"}, CASO_VALOR_ACTUAL={4}, ESSO_ID_ESTADO*={3,4}>} SOLI_ID_SOLICITUD)
+
count(DISTINCT {<[Tipo Fecha]={$(vTipoFecha)}, Foto = {'Publicación anual'}, Mes={"<=$(=max(Mes))"}, ESSO_ID_ESTADO*={3,4}, SOLI_ID_SOLICITUD*=E({<ESSO_ID_ESTADO*={3,4}, [Transición sin precedente]=, [Tipo Fecha]={$(vTipoFecha)},
Foto = {'Publicación anual'},CASO_VALOR_ACTUAL={4}>}SOLI_ID_SOLICITUD)>} SOLI_ID_SOLICITUD), [Transición sin precedente],Año))
)
My intention is show Valor_Grafico how dimension, and calculate the expression controlling with IF the accumulation condition, but always show the month or the accumulation. Never two.
How can show two values at the same time?
Very thanks.
Bye.
- Mark as New
- Bookmark
- Subscribe
- Mute
- Subscribe to RSS Feed
- Permalink
- Report Inappropriate Content
Would you be able to share a sample qvw to show the issue and also provide the expected output for the sample qvw provided?
- Mark as New
- Bookmark
- Subscribe
- Mute
- Subscribe to RSS Feed
- Permalink
- Report Inappropriate Content
Select a year and a month. The bar char show month´s value and accumulated to current month. This success, but is a easy example...
- Mark as New
- Bookmark
- Subscribe
- Mute
- Subscribe to RSS Feed
- Permalink
- Report Inappropriate Content
What would you want to see instead?
- Mark as New
- Bookmark
- Subscribe
- Mute
- Subscribe to RSS Feed
- Permalink
- Report Inappropriate Content
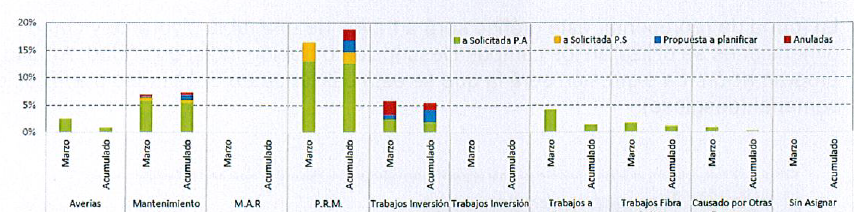
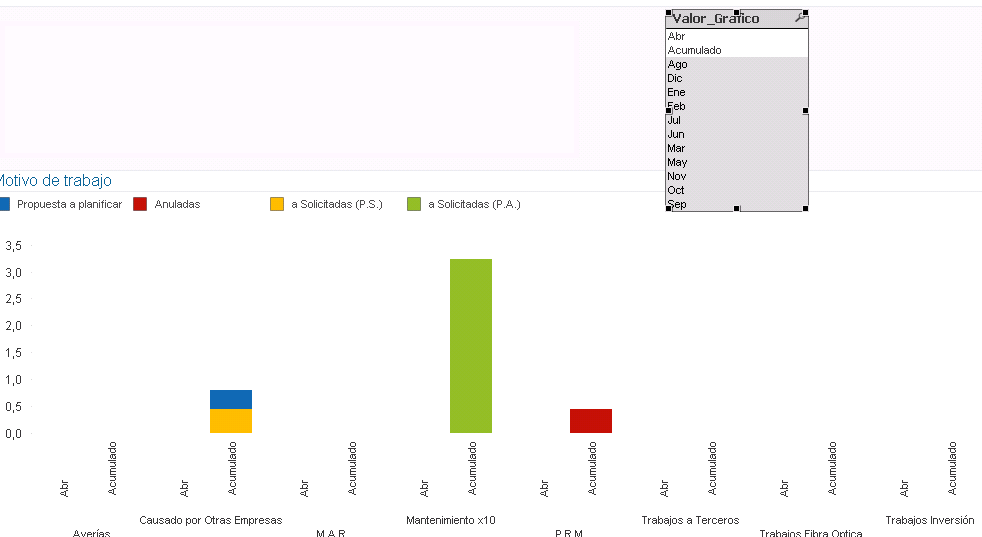
That´s I want see, but not show in the real qw, only I see month´s value or accumulated:

- Mark as New
- Bookmark
- Subscribe
- Mute
- Subscribe to RSS Feed
- Permalink
- Report Inappropriate Content
Can you convert your chart into a straight table (may be create a copy and do this) and see if you see 0's or a number which is too small to show up on the chart? Also, if you can share a reduced version of your actual application, I might be able to see what the issue is
Preparing examples for Upload - Reduction and Data Scrambling
- Mark as New
- Bookmark
- Subscribe
- Mute
- Subscribe to RSS Feed
- Permalink
- Report Inappropriate Content
Sorry, I can´t share the QW of my client (confidentiallity policy) 
- Mark as New
- Bookmark
- Subscribe
- Mute
- Subscribe to RSS Feed
- Permalink
- Report Inappropriate Content
Did you look at the attached link? It does address confidentiality concerns. You can scramble the data before you add the qvw here
- Mark as New
- Bookmark
- Subscribe
- Mute
- Subscribe to RSS Feed
- Permalink
- Report Inappropriate Content
Yes, I look the link, but I can´t. Prohibited. Sorry and thanks.