Unlock a world of possibilities! Login now and discover the exclusive benefits awaiting you.
- Qlik Community
- :
- All Forums
- :
- QlikView App Dev
- :
- Re: Straight Table Calculation for the Previous Da...
- Subscribe to RSS Feed
- Mark Topic as New
- Mark Topic as Read
- Float this Topic for Current User
- Bookmark
- Subscribe
- Mute
- Printer Friendly Page
- Mark as New
- Bookmark
- Subscribe
- Mute
- Subscribe to RSS Feed
- Permalink
- Report Inappropriate Content
Straight Table Calculation for the Previous Date Formula
Hi friends!
Help to write the formula that calculates values for the previous period inside current period in chart.
Like on screenshot below:
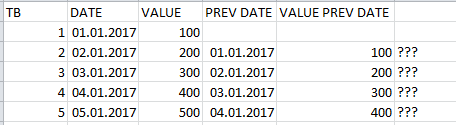
Trying to calculate measure "VALUE PREV DATE"
Sum(Aggr(sum({<Date={"$(=If(Dimensionality()=0,
Date(MonthEnd(AddMonths(max(Date),-1))),
Date(MonthEnd(AddMonths(max(Date),-1)))))"}>} [VALUE]),TB))
Doesnt works, because showing single value 
Please help!
Thanks in advance.
- « Previous Replies
-
- 1
- 2
- Next Replies »
- Mark as New
- Bookmark
- Subscribe
- Mute
- Subscribe to RSS Feed
- Permalink
- Report Inappropriate Content
I am confused here.
| TB | DATE | VALUE | PREV DATE | VALUE PREV DATE |
| 1 | 01.01.2017 | 100 | 02.01.2017 | 200 |
| 2 | 02.01.2017 | 200 | 03.01.2017 | 300 |
| 3 | 03.01.2017 | 300 | 04.01.2017 | 400 |
| 4 | 04.01.2017 | 400 | 05.01.2017 | 500 |
| 5 | 05.01.2017 | 500 |
How come 02.01.2017 is previous date for 01.01.2017?
- Mark as New
- Bookmark
- Subscribe
- Mute
- Subscribe to RSS Feed
- Permalink
- Report Inappropriate Content
Omg. My falt...
FINALLY: I has field wiht dates ( only with first dates of months ).
01.01.2017
01.02.2017
01.03.2017
01.04.2017
01.05.2017
The table should looks like that:
| TB | DATE | VALUE | PREV DATE | VALUE PREV MONTH |
| 1 | 01.01.2017 | 100 | 01.12.2016 | - |
| 2 | 01.02.2017 | 200 | 01.01.2017 | 100 |
| 3 | 01.03.2017 | 300 | 01.02.2017 | 200 |
| 4 | 01.04.2017 | 400 | 01.03.2017 | 300 |
| 5 | 01.05.2017 | 500 | 01.04.2017 | 400 |
I need to calculate measure "VALUE PREV MONTH".
- « Previous Replies
-
- 1
- 2
- Next Replies »