Unlock a world of possibilities! Login now and discover the exclusive benefits awaiting you.
- Qlik Community
- :
- All Forums
- :
- QlikView App Dev
- :
- Re: Sub Total of 2 dimensions
- Subscribe to RSS Feed
- Mark Topic as New
- Mark Topic as Read
- Float this Topic for Current User
- Bookmark
- Subscribe
- Mute
- Printer Friendly Page
- Mark as New
- Bookmark
- Subscribe
- Mute
- Subscribe to RSS Feed
- Permalink
- Report Inappropriate Content
Sub Total of 2 dimensions
Hello
I built a pivot table with 2 dimensions on rows (Region and Sales Rep).
3 Expressions in columns.
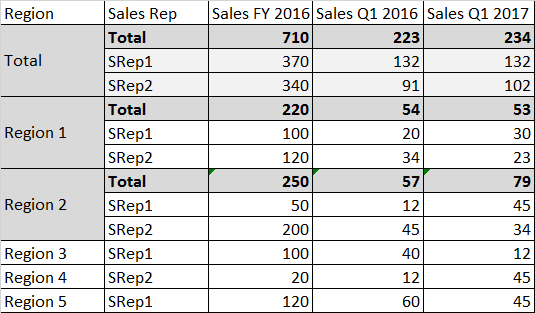
I'm trying to have on top rows the aggregation of 2 dimensions (Since Sales rep work on all regions).
Could someone tell me if it's possible to do as in this picture ?
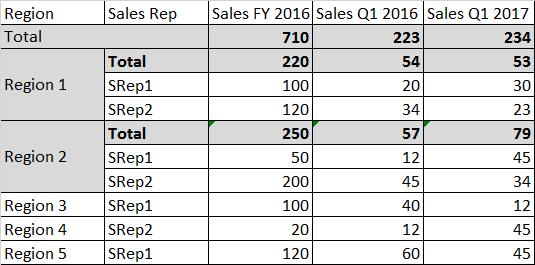
See below, what I have is only one line of total on the first dimension. So no way to see the total per sales rep in the same table...unless someone can help 
Thanks for your help
G
- « Previous Replies
-
- 1
- 2
- Next Replies »
Accepted Solutions
- Mark as New
- Bookmark
- Subscribe
- Mute
- Subscribe to RSS Feed
- Permalink
- Report Inappropriate Content
- Mark as New
- Bookmark
- Subscribe
- Mute
- Subscribe to RSS Feed
- Permalink
- Report Inappropriate Content
Would you be able to share your app to play around with?
- Mark as New
- Bookmark
- Subscribe
- Mute
- Subscribe to RSS Feed
- Permalink
- Report Inappropriate Content
Could you please share some sample data
- Mark as New
- Bookmark
- Subscribe
- Mute
- Subscribe to RSS Feed
- Permalink
- Report Inappropriate Content
Sure
Hope this will help
Thanks a lot
- Mark as New
- Bookmark
- Subscribe
- Mute
- Subscribe to RSS Feed
- Permalink
- Report Inappropriate Content
I don't think there is another approach to do this. I know i did follow the stupid Approach. But, Interesting
- Mark as New
- Bookmark
- Subscribe
- Mute
- Subscribe to RSS Feed
- Permalink
- Report Inappropriate Content
Thanks for your answer Anil
I hope there is an other way, since in my live application, the crosstable control is in a Tab control which makes the overlap not really convenient
- Mark as New
- Bookmark
- Subscribe
- Mute
- Subscribe to RSS Feed
- Permalink
- Report Inappropriate Content
Let's try from my end. If i came to know any address i may connect you again. Interesting
- Mark as New
- Bookmark
- Subscribe
- Mute
- Subscribe to RSS Feed
- Permalink
- Report Inappropriate Content
I cross my fingers
Thanks Anil
- Mark as New
- Bookmark
- Subscribe
- Mute
- Subscribe to RSS Feed
- Permalink
- Report Inappropriate Content
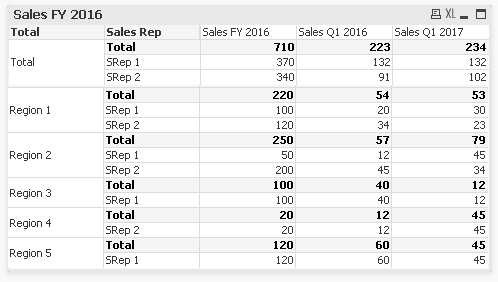
May be something along these lines
- Mark as New
- Bookmark
- Subscribe
- Mute
- Subscribe to RSS Feed
- Permalink
- Report Inappropriate Content
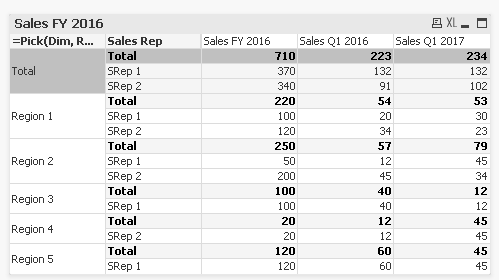
Thanks sunny, it seems a very good option.
Could you give me a quick explanation of the logic (use of Dim), and also why you typed "Only({1}Dim)" in the sorting part. I did not get it from the documentation.
Thanks again
- « Previous Replies
-
- 1
- 2
- Next Replies »