Unlock a world of possibilities! Login now and discover the exclusive benefits awaiting you.
- Qlik Community
- :
- All Forums
- :
- QlikView App Dev
- :
- Re: Sub Total of 2 dimensions
- Subscribe to RSS Feed
- Mark Topic as New
- Mark Topic as Read
- Float this Topic for Current User
- Bookmark
- Subscribe
- Mute
- Printer Friendly Page
- Mark as New
- Bookmark
- Subscribe
- Mute
- Subscribe to RSS Feed
- Permalink
- Report Inappropriate Content
Sub Total of 2 dimensions
Hello
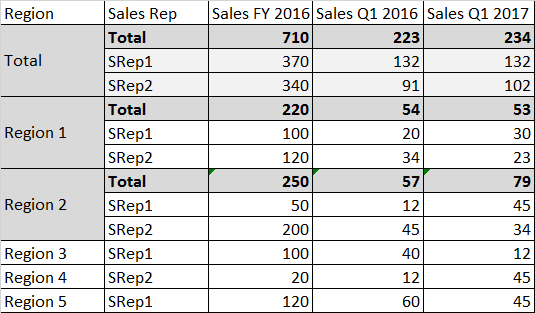
I built a pivot table with 2 dimensions on rows (Region and Sales Rep).
3 Expressions in columns.
I'm trying to have on top rows the aggregation of 2 dimensions (Since Sales rep work on all regions).
Could someone tell me if it's possible to do as in this picture ?

See below, what I have is only one line of total on the first dimension. So no way to see the total per sales rep in the same table...unless someone can help ![]()

Thanks for your help
G
- « Previous Replies
-
- 1
- 2
- Next Replies »
Accepted Solutions
- Mark as New
- Bookmark
- Subscribe
- Mute
- Subscribe to RSS Feed
- Permalink
- Report Inappropriate Content
- Mark as New
- Bookmark
- Subscribe
- Mute
- Subscribe to RSS Feed
- Permalink
- Report Inappropriate Content
Would you be able to share your app to play around with?
- Mark as New
- Bookmark
- Subscribe
- Mute
- Subscribe to RSS Feed
- Permalink
- Report Inappropriate Content
Could you please share some sample data
- Mark as New
- Bookmark
- Subscribe
- Mute
- Subscribe to RSS Feed
- Permalink
- Report Inappropriate Content
Sure
Hope this will help
Thanks a lot
- Mark as New
- Bookmark
- Subscribe
- Mute
- Subscribe to RSS Feed
- Permalink
- Report Inappropriate Content
I don't think there is another approach to do this. I know i did follow the stupid Approach. But, Interesting ![]()
- Mark as New
- Bookmark
- Subscribe
- Mute
- Subscribe to RSS Feed
- Permalink
- Report Inappropriate Content
Thanks for your answer Anil
I hope there is an other way, since in my live application, the crosstable control is in a Tab control which makes the overlap not really convenient
- Mark as New
- Bookmark
- Subscribe
- Mute
- Subscribe to RSS Feed
- Permalink
- Report Inappropriate Content
Let's try from my end. If i came to know any address i may connect you again. Interesting ![]()
- Mark as New
- Bookmark
- Subscribe
- Mute
- Subscribe to RSS Feed
- Permalink
- Report Inappropriate Content
I cross my fingers ![]()
Thanks Anil
- Mark as New
- Bookmark
- Subscribe
- Mute
- Subscribe to RSS Feed
- Permalink
- Report Inappropriate Content
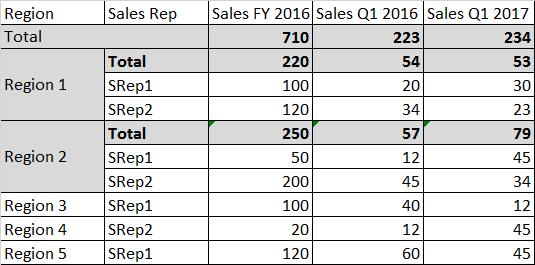
May be something along these lines
- Mark as New
- Bookmark
- Subscribe
- Mute
- Subscribe to RSS Feed
- Permalink
- Report Inappropriate Content
Thanks sunny, it seems a very good option.
Could you give me a quick explanation of the logic (use of Dim), and also why you typed "Only({1}Dim)" in the sorting part. I did not get it from the documentation.
Thanks again
- « Previous Replies
-
- 1
- 2
- Next Replies »