Unlock a world of possibilities! Login now and discover the exclusive benefits awaiting you.
- Qlik Community
- :
- All Forums
- :
- QlikView App Dev
- :
- Re: Sum Up Top N
- Subscribe to RSS Feed
- Mark Topic as New
- Mark Topic as Read
- Float this Topic for Current User
- Bookmark
- Subscribe
- Mute
- Printer Friendly Page
- Mark as New
- Bookmark
- Subscribe
- Mute
- Subscribe to RSS Feed
- Permalink
- Report Inappropriate Content
Sum Up Top N
HI every one ,
I have below sample data:
REPORT_DATE | month | Site_ID | outage |
6/1/2016 | 2016-06 | 1 | 120 |
6/2/2016 | 2016-06 | 1 | 500 |
6/1/2016 | 2016-06 | 2 | 300 |
7/1/2016 | 2016-07 | 4 | 120 |
7/2/2016 | 2016-07 | 3 | 500 |
7/2/2016 | 2016-07 | 3 | 300 |
I want to sum up Top N Site Outage per month (first i should calculate site outage per month then sum up top N site outage per month) . I have to do it in front end (in expression) not in script.
I appreciate if someone help me.
- « Previous Replies
-
- 1
- 2
- Next Replies »
- Mark as New
- Bookmark
- Subscribe
- Mute
- Subscribe to RSS Feed
- Permalink
- Report Inappropriate Content
Hi Nassim,
What do you mean by Top N over here ? N could be any value ?
BR,
KC
KC
- Mark as New
- Bookmark
- Subscribe
- Mute
- Subscribe to RSS Feed
- Permalink
- Report Inappropriate Content
Try like:
=Sum(Aggr(If(Rank(Sum(outage))<=vTop, Sum(outage)), Site_ID))
- Mark as New
- Bookmark
- Subscribe
- Mute
- Subscribe to RSS Feed
- Permalink
- Report Inappropriate Content
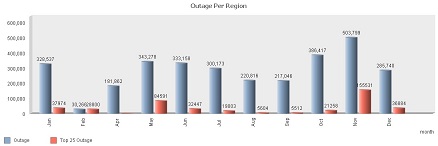
 thanks Tresesco , but need Top N per Month , actually finally i need a chart like below
- Mark as New
- Bookmark
- Subscribe
- Mute
- Subscribe to RSS Feed
- Permalink
- Report Inappropriate Content
PFA
- Mark as New
- Bookmark
- Subscribe
- Mute
- Subscribe to RSS Feed
- Permalink
- Report Inappropriate Content
Sorry Tressco i couldn't reply on your last post ,
by the way , i don't want to add site_id in Dimension ,( As you can see in the chart there is two bar for each month total monthly outage and top25Site outage ) so now how can i first calculate monthly sum of outage per side_id and then sum up Outage of top N site_id .
- Mark as New
- Bookmark
- Subscribe
- Mute
- Subscribe to RSS Feed
- Permalink
- Report Inappropriate Content
some actual data attached
- Mark as New
- Bookmark
- Subscribe
- Mute
- Subscribe to RSS Feed
- Permalink
- Report Inappropriate Content
Not really sure about your requirement.
- Mark as New
- Bookmark
- Subscribe
- Mute
- Subscribe to RSS Feed
- Permalink
- Report Inappropriate Content
during last week i tried to find a solution but still i am confused .
- Mark as New
- Bookmark
- Subscribe
- Mute
- Subscribe to RSS Feed
- Permalink
- Report Inappropriate Content
Now since you are here, please try more on clarifying your requirement better.
- « Previous Replies
-
- 1
- 2
- Next Replies »