Unlock a world of possibilities! Login now and discover the exclusive benefits awaiting you.
- Qlik Community
- :
- All Forums
- :
- QlikView App Dev
- :
- Trend
- Subscribe to RSS Feed
- Mark Topic as New
- Mark Topic as Read
- Float this Topic for Current User
- Bookmark
- Subscribe
- Mute
- Printer Friendly Page
- Mark as New
- Bookmark
- Subscribe
- Mute
- Subscribe to RSS Feed
- Permalink
- Report Inappropriate Content
Trend
Hello
In my visualisation I want to add a trendline but I don't want it to adjust when a filter is selected.
How can I do this?
- Mark as New
- Bookmark
- Subscribe
- Mute
- Subscribe to RSS Feed
- Permalink
- Report Inappropriate Content
how are you adding the trend line?
add and expression with 1 as identifier to ignore all selections
example
Sum({1}Sales) << this will ignore any selections made in the entire app
if you want to ignore a specific field, then
sum({<field1=,field2=>}Sales) << here selections in field1 and field2 will be ignored
If a post helps to resolve your issue, please accept it as a Solution.
- Mark as New
- Bookmark
- Subscribe
- Mute
- Subscribe to RSS Feed
- Permalink
- Report Inappropriate Content
I just made an extra line graph
- Mark as New
- Bookmark
- Subscribe
- Mute
- Subscribe to RSS Feed
- Permalink
- Report Inappropriate Content
Did you try as above with your expression?
if it's confusing , post the expression for your line and I'll show you where to edit
If a post helps to resolve your issue, please accept it as a Solution.
- Mark as New
- Bookmark
- Subscribe
- Mute
- Subscribe to RSS Feed
- Permalink
- Report Inappropriate Content
So what I want is to have a trendline from stage 1 (the purple bars) in a seperate line graph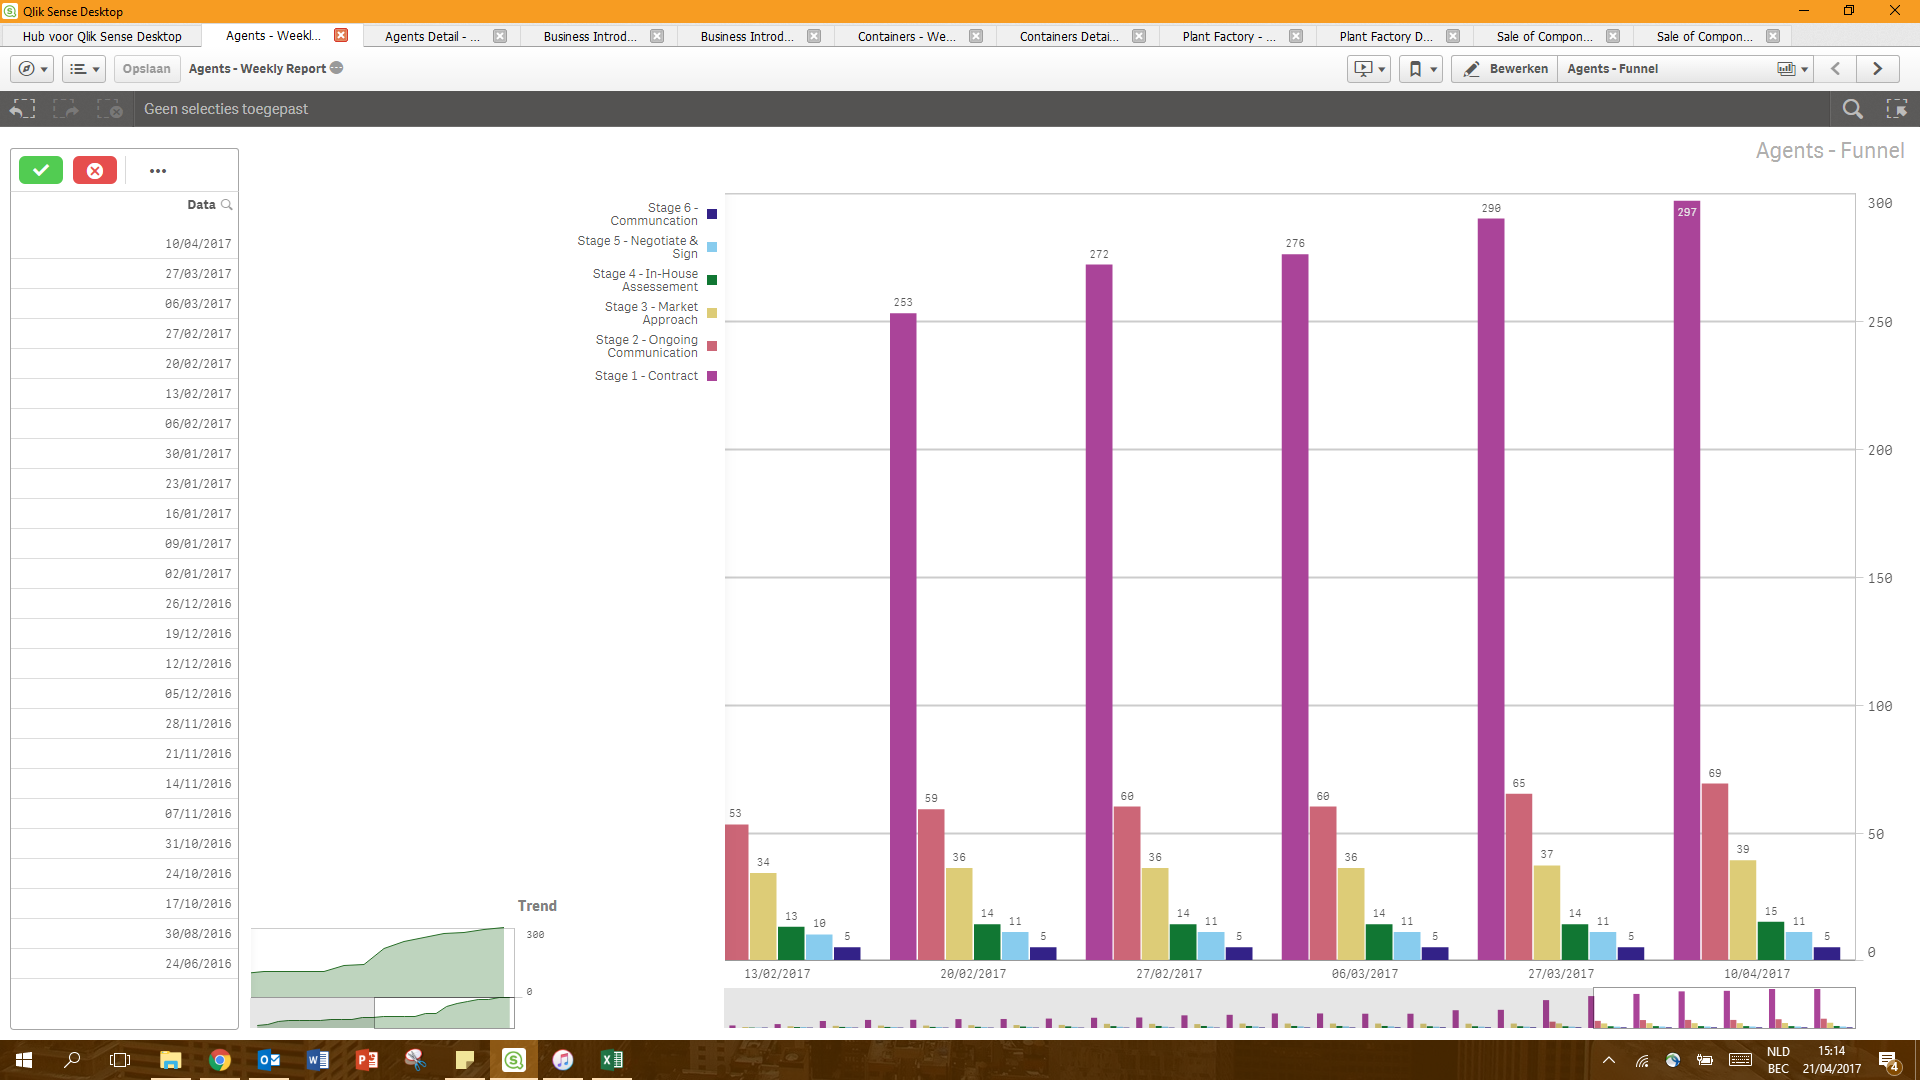
- Mark as New
- Bookmark
- Subscribe
- Mute
- Subscribe to RSS Feed
- Permalink
- Report Inappropriate Content
You should use a combo chart instead of a bar chart
If you are already using a combo chart,
under MEasures >>
Click on the Measure you want to show as line
>> Select Line (Bar | Line | Marker options will be available)
If a post helps to resolve your issue, please accept it as a Solution.
- Mark as New
- Bookmark
- Subscribe
- Mute
- Subscribe to RSS Feed
- Permalink
- Report Inappropriate Content
Use combo chart, select one new measure with same expression as Stage 1 measure and select line option in expression tab. This way you will have line and bar both for stage 1, line will appear as a trend.