Unlock a world of possibilities! Login now and discover the exclusive benefits awaiting you.
- Qlik Community
- :
- All Forums
- :
- QlikView App Dev
- :
- Re: Up/Down arrow based on pivot table which is us...
- Subscribe to RSS Feed
- Mark Topic as New
- Mark Topic as Read
- Float this Topic for Current User
- Bookmark
- Subscribe
- Mute
- Printer Friendly Page
- Mark as New
- Bookmark
- Subscribe
- Mute
- Subscribe to RSS Feed
- Permalink
- Report Inappropriate Content
Up/Down arrow based on pivot table which is using Valuelist
I have pivot table something as below. I want to show UP/Down arrow next to each of the measures. So the condition is if measure >=0 then UP Arrow(In Green) and if the measure is less <0 then DOWN arrow(In Red).
Since I have been using Valuelist here I am not sure how to achieve this here.
Please help me out to achieve this.
- « Previous Replies
- Next Replies »
Accepted Solutions
- Mark as New
- Bookmark
- Subscribe
- Mute
- Subscribe to RSS Feed
- Permalink
- Report Inappropriate Content
Never tried this before but according to this thread you can change the number format to ▲ #,##0;▼ #,##0 (slightly different for you as they are percentages), then use the 'visual cues' tab in the chart's properties to colour the values.
- Mark as New
- Bookmark
- Subscribe
- Mute
- Subscribe to RSS Feed
- Permalink
- Report Inappropriate Content
Thanks! Yes that i already got it. But my request was how can i use the visual cues in the valuelist.
- Mark as New
- Bookmark
- Subscribe
- Mute
- Subscribe to RSS Feed
- Permalink
- Report Inappropriate Content
Any further updates from anyone on this? Please help...
- Mark as New
- Bookmark
- Subscribe
- Mute
- Subscribe to RSS Feed
- Permalink
- Report Inappropriate Content
???
- Mark as New
- Bookmark
- Subscribe
- Mute
- Subscribe to RSS Feed
- Permalink
- Report Inappropriate Content
Hi,
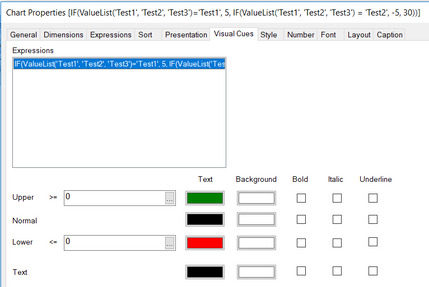
I'm not entirely sure what the problem is, I created a chart using valuelist as a calculated dimension and visual cues seem to work just fine (see images below). Could you post the dimensions/expressions you are using (or even better, a copy of your application)? That would make it a lot easier to find the cause of your problems.
- Mark as New
- Bookmark
- Subscribe
- Mute
- Subscribe to RSS Feed
- Permalink
- Report Inappropriate Content
Thanks again for your response...
Application has already been attached in the initial post. Please check above and let me know if you find something ASAP...
Also please note that the up/down arrow should be in a separate column next to each of the measures. Please let me know if you have any questions.
- Mark as New
- Bookmark
- Subscribe
- Mute
- Subscribe to RSS Feed
- Permalink
- Report Inappropriate Content
Did you get any chance to look into it? Please share if you find some solution... Please ping once you have received this message...
- Mark as New
- Bookmark
- Subscribe
- Mute
- Subscribe to RSS Feed
- Permalink
- Report Inappropriate Content
Hi,
Sorry, I did not see that you had already attached your application.
Also, please have some patience, I get that you probably have deadlines to meet but I do have other things to do as well.
I've attached a qvw file to show how I would personally solve this. I simply added expressions to check whether the existing expressions were positive or negative, and then return an up or down arrow. I did swap the columns/rows for this because I think that's more clear, but that's for you to decide.
If you wanted to do it exactly as you described (your current table, but with extra columns showing increase or decrease), you'd have to add those fields to your valuelist (something like Valuelist('Last 3 months', 'Change1', 'Last 6 months', 'Change2', 'Next 3 months', Change3')) and then modify your expressions to something along the lines of:
If(Valuelist='Last 3 months', *last 3 months expression*, If(Valuelist= 'Change1', If(*last 3 months expression* < 0, down arrow, up arrow), if(Valuelist='Last 6 months', *last 6 months expression*)....... and so on
I 1000% prefer the first solution, as the second would make your expressions incredibly long, making them harder to read and they will take longer to calculate (which may or may not be a problem depending on the size of your dataset).
Hope this helps.
- Mark as New
- Bookmark
- Subscribe
- Mute
- Subscribe to RSS Feed
- Permalink
- Report Inappropriate Content
One small adjustment to what I originally posted: I changed the expressions to IF(Column(1)<0, Dual(chr(9660), -1), Dual(chr(9650), 1)), so that the arrows have a numerical value as well. This means that we can use the visual cues tab to change the colour of the arrows to green or red to match the expression results.
- « Previous Replies
- Next Replies »


