Unlock a world of possibilities! Login now and discover the exclusive benefits awaiting you.
- Qlik Community
- :
- All Forums
- :
- QlikView App Dev
- :
- Re: Variable
- Subscribe to RSS Feed
- Mark Topic as New
- Mark Topic as Read
- Float this Topic for Current User
- Bookmark
- Subscribe
- Mute
- Printer Friendly Page
- Mark as New
- Bookmark
- Subscribe
- Mute
- Subscribe to RSS Feed
- Permalink
- Report Inappropriate Content
Variable
Hi All,
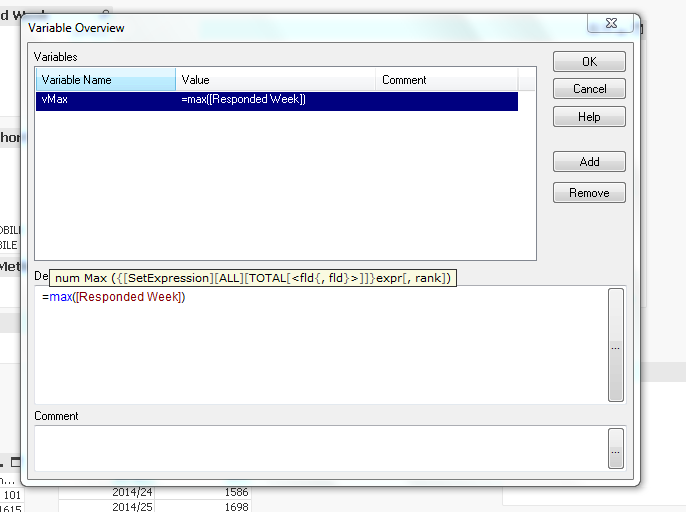
I just want to know , how to know what is ther in the variable , i dont know how to see it , under variable overview i can see only the name of the variable but now the detail can some one hlp me plz
Thanks for ur reply iam attaching my qvw file , In which u can see the rank box and a bar chart if u insert the value in the box accordingly it will show the bars max is 5 , i just want to know what is the logic behind and how to see the variable details thank .
- Tags:
- new_to_qlikview
- Mark as New
- Bookmark
- Subscribe
- Mute
- Subscribe to RSS Feed
- Permalink
- Report Inappropriate Content
Hi wrestler,
go to variable overview, and click over the variable, in below text you will get definition of that variable.
Thanks
Vishal
- Mark as New
- Bookmark
- Subscribe
- Mute
- Subscribe to RSS Feed
- Permalink
- Report Inappropriate Content
Hi wrestler,
That means the variables is not defined. You can click on the variable and define an expression for it.
- Mark as New
- Bookmark
- Subscribe
- Mute
- Subscribe to RSS Feed
- Permalink
- Report Inappropriate Content
Thanks for ur reply iam attaching my qvw file , In which u can see the rank box and a bar chart if u insert the value in the box accordingly it will show the bars max is 5 , i just want to know what is the logic behind and how to see the variable details thank .
- Mark as New
- Bookmark
- Subscribe
- Mute
- Subscribe to RSS Feed
- Permalink
- Report Inappropriate Content
hi
be sure that variable is created on front end side means in variable overview for this
go to variable overview select the variable and below in definition you'll see the condition
if its created on scripting side then it always gives you the value based on condition put in variable.
- Mark as New
- Bookmark
- Subscribe
- Mute
- Subscribe to RSS Feed
- Permalink
- Report Inappropriate Content
Hi,
I believe that you're trying to understand something done by someone else, right ?
Your variable is just a number that the user inputs.
It is then being used in the cyclic group in a calculated dimension.
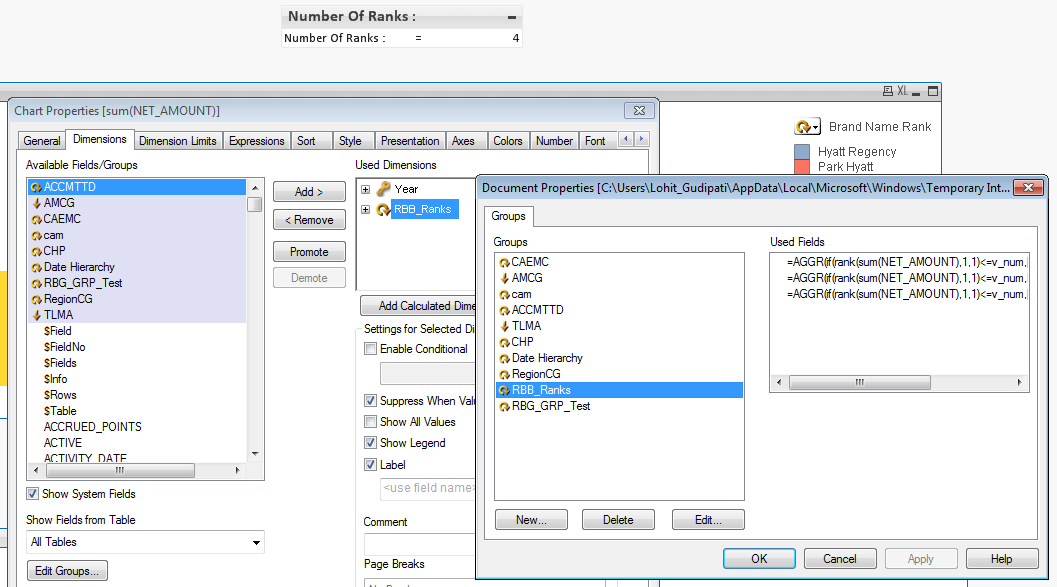
Go to Settings > Document Properties > Groups > select RBB_Ranks and click Edit, check how each dimension is being formed, only the first n values of the dimensions will be displayed based on their ranking of sum(net_amount).
Your chart uses RBB_Ranks as a dimension.
Hope that this is what you're looking for.
- Mark as New
- Bookmark
- Subscribe
- Mute
- Subscribe to RSS Feed
- Permalink
- Report Inappropriate Content
The logic is in the groups created in the dimension. Find the attached snapshot below
- Mark as New
- Bookmark
- Subscribe
- Mute
- Subscribe to RSS Feed
- Permalink
- Report Inappropriate Content
Thanks a lot lohit , .