Unlock a world of possibilities! Login now and discover the exclusive benefits awaiting you.
- Qlik Community
- :
- All Forums
- :
- QlikView App Dev
- :
- YTD,QTD MTD Tables with Sum(Sales)
- Subscribe to RSS Feed
- Mark Topic as New
- Mark Topic as Read
- Float this Topic for Current User
- Bookmark
- Subscribe
- Mute
- Printer Friendly Page
- Mark as New
- Bookmark
- Subscribe
- Mute
- Subscribe to RSS Feed
- Permalink
- Report Inappropriate Content
YTD,QTD MTD Tables with Sum(Sales)
Hello Everyone can any one tell me how to create a Sales chart with YTD,QTD,MTD with Sum of Sales please..,Thank you
Regard's
shiva
- Mark as New
- Bookmark
- Subscribe
- Mute
- Subscribe to RSS Feed
- Permalink
- Report Inappropriate Content
Lots of ways and it depends on what you're after. If it's always based on the current date, you could just load up YTD, QTD and MTD flags with your raw data based on the sales date vs. today(). Then just reference the flags, such as:
Dimension = Date
YTD = sum({<YTD={1}>} Sales)
If it's always based on a selected date, or the most recent selected date, then something like:
YTD = sum({<Year={'$(=max(Year))'},Quarter=,Month=,Date={"<=$(=max(Date))"}>} Sales)
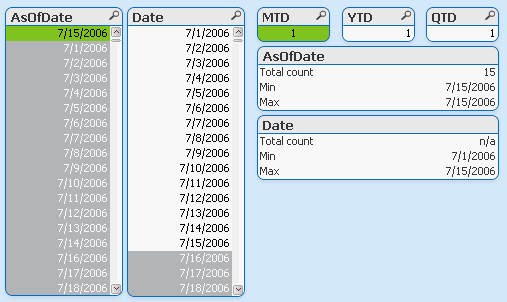
If you want to be able to see all the dates of the year, each with their own YTD, QTD, MTD data, all at the same time, then I'd handle it with data:
AsOf:
LOAD DISTINCT Date as AsOfDate
RESIDENT Whatever
;
LEFT JOIN (AsOf)
LOAD AsOfDate as Date
RESIDENT AsOf
;
INNER JOIN (AsOf)
LOAD *,1 as YTD
RESIDENT (AsOf)
WHERE year(AsOfDate) = year(Date)
AND AsOfDate >= Date
;
LEFT JOIN (AsOf)
LOAD *
,if(quarterstart(AsOfDate)=quarterstart(Date),1) as QTD
,if(monthstart(AsOfDate)=monthstart(Date),1) as MTD
RESIDENT (AsOf)
;
Dimension = AsOfDate
YTD = sum({<YTD={1}>} Sales)
etc.
- Mark as New
- Bookmark
- Subscribe
- Mute
- Subscribe to RSS Feed
- Permalink
- Report Inappropriate Content
John,
That's pretty slick. Simple, elegant and fast. ![]()
In terms of user selections, I believe you also need to base your user selections on the AsOfDate instead of the date and then have your chart dimensions be based on the date ...

- Mark as New
- Bookmark
- Subscribe
- Mute
- Subscribe to RSS Feed
- Permalink
- Report Inappropriate Content
I have attached one file .This file helpful MTD/YTD for sales ,others
- Mark as New
- Bookmark
- Subscribe
- Mute
- Subscribe to RSS Feed
- Permalink
- Report Inappropriate Content
that's also very impressive as far as set analysis goes. A very nice example of how to do things in different ways, thanks for uploading that.
Question for you: how much data can that handle? Would it have trouble with a large data set since so much is done via set analysis in the charts?
- Mark as New
- Bookmark
- Subscribe
- Mute
- Subscribe to RSS Feed
- Permalink
- Report Inappropriate Content
Hello,
I have used the technic given by john to calculate all my indicators: YTD, MTD, YTD-1,...
It is very efficient as I can put a slider and see how behave the YTD from 1month to another. I am no longer stuck to the YTD of the current month
Problem is that I can't calculate the %growth between YTD and YTD-1
Here is my initial post, including my code:
http://community.qlik.com/message/103934#103934
How could i solve my problem? (related topic: http://community.qlik.com/message/105237#105237)
Thanks in advance,
Nicolas
- Mark as New
- Bookmark
- Subscribe
- Mute
- Subscribe to RSS Feed
- Permalink
- Report Inappropriate Content
Hi John,
Could you please give insight, how we can use YTD,QTD filters on UI. Lets say, i am selecting Period Type as QTD and selecting a particular date e.g 4/8/2014, then my data should show from 1/8/2014.
- Mark as New
- Bookmark
- Subscribe
- Mute
- Subscribe to RSS Feed
- Permalink
- Report Inappropriate Content
How to use these flags in CY,FPY,SPF in set analysis for calulating sum of sales