Unlock a world of possibilities! Login now and discover the exclusive benefits awaiting you.
- Qlik Community
- :
- All Forums
- :
- QlikView App Dev
- :
- aggr function
- Subscribe to RSS Feed
- Mark Topic as New
- Mark Topic as Read
- Float this Topic for Current User
- Bookmark
- Subscribe
- Mute
- Printer Friendly Page
- Mark as New
- Bookmark
- Subscribe
- Mute
- Subscribe to RSS Feed
- Permalink
- Report Inappropriate Content
aggr function
Hello all,
I have a straight table, the dimension contains the calculated dimension of ValueLoop(100,150) and the expression is quite complicated like this :
=(Sum( {$<[Value Date] = {"<=$(v_MaxDate)"}>}
If (PC = 'Put' AND ValueLoop(100,150) -[Expiration Index] < 0,
((ValueLoop(100,150) - [Expiration Index]) * [Quantity] * -[Factor]),
If (PC = 'Call' AND ValueLoop(100,150) -[Expiration Index] > 0,
((ValueLoop(100,150) - [Expiration Index]) * [Quantity] * [Factor])))) - Sum ([Premium]))
And it works file.
I need to display the minimum value and the maximum value of the list of values displayed in the chart. These 2 numbers should be displayed in 2 variables outside the chart because I need a further calculation on these 2 numbers and only then, they will be the actual output.
Actually, the Min value should be from 15% from the beginning of the list and the Max value should be from 15% from the end of the list of values.
Can someone help me with this?
- Tags:
- aggr help
- Mark as New
- Bookmark
- Subscribe
- Mute
- Subscribe to RSS Feed
- Permalink
- Report Inappropriate Content
This is not much complicated,
Would you provide this
What is the Value of this -- v_MaxDate
LET VExpression = ValueLoop(100,150) -[Expiration Index]
Perhaps This
=(Sum({$<[Value Date] = {"<=$(v_MaxDate)"}>},
If (PC = 'Put' AND (ValueLoop(100,150) -[Expiration Index]) < 0,
((ValueLoop(100,150) - [Expiration Index]) * [Quantity] * (-[Factor])),
If (PC = 'Call' AND (ValueLoop(100,150) -[Expiration Index]) > 0,
((ValueLoop(100,150) - [Expiration Index]) * [Quantity] * [Factor])))) - Sum ([Premium]))
OR
Sum({$<[Value Date] = {"<=$(v_MaxDate)"}, PC={'Put','Call'}, If(VExpression<0, ($(VExpression) * Quantity * (-Factor)), ($(VExpression) * Quantity * Factor) >} Premium) - Sum(Premium)
- Mark as New
- Bookmark
- Subscribe
- Mute
- Subscribe to RSS Feed
- Permalink
- Report Inappropriate Content
Is it possible to share a sample where you have been playing around with it? May be it is easier to see what you have and take it forward from there?
QlikCommunity Tip: How to get answers to your post?
Preparing examples for Upload - Reduction and Data Scrambling
- Mark as New
- Bookmark
- Subscribe
- Mute
- Subscribe to RSS Feed
- Permalink
- Report Inappropriate Content
the last requirement is bit confusing related to 15% from beginning and 15% from end, not sure if you need your resulted values in sorted order. Do you mean if you have 100 values then you want to calculate min and max between 15th to 85th value or something else?
- Mark as New
- Bookmark
- Subscribe
- Mute
- Subscribe to RSS Feed
- Permalink
- Report Inappropriate Content
Thanks for your answer,
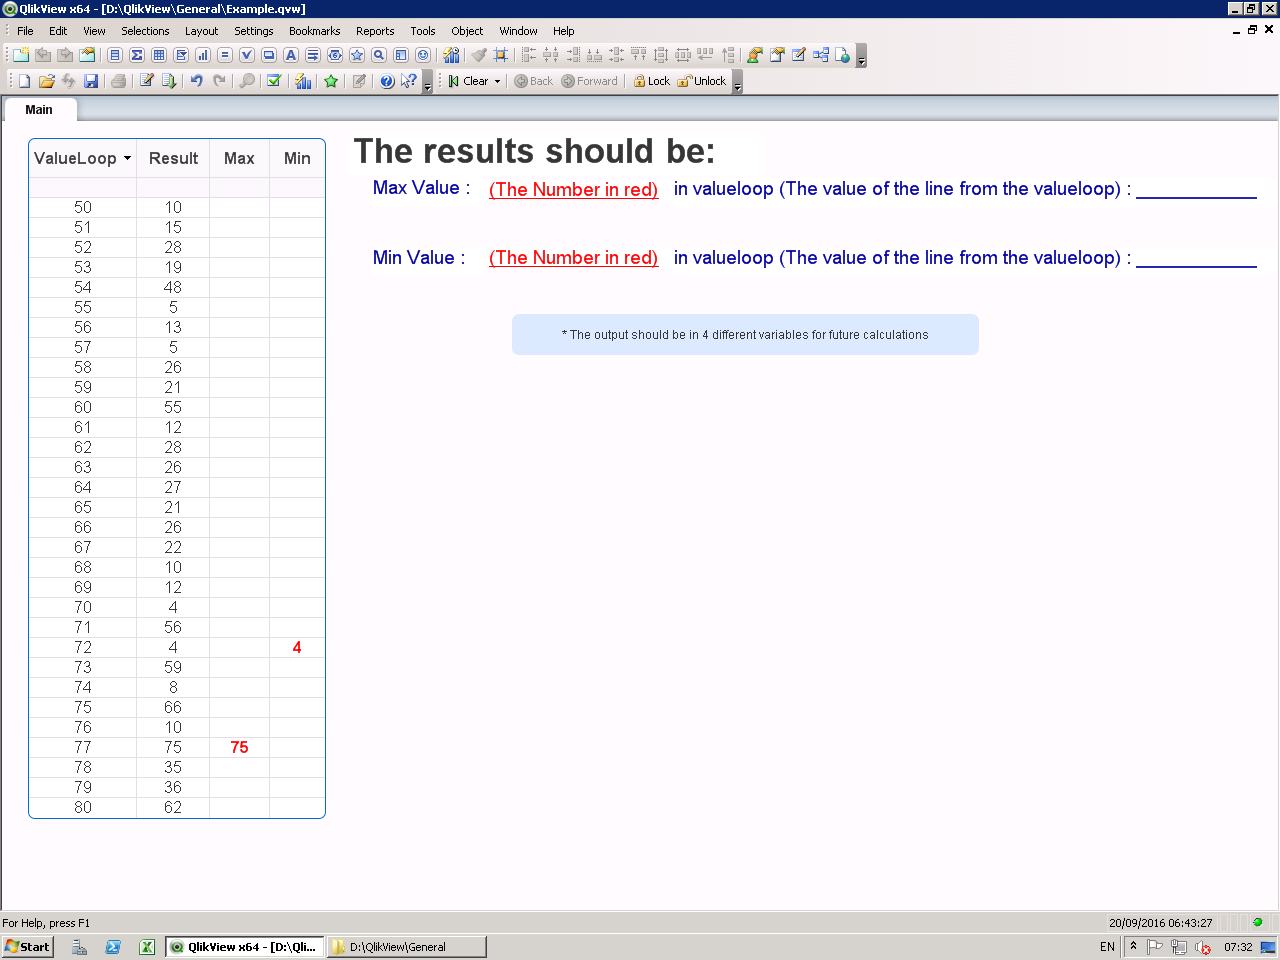
Maybe a made it too complicated, see the attached print screen. I made a simple scenario and as you can see, the results should be 4 figures.
Many thanks
- Mark as New
- Bookmark
- Subscribe
- Mute
- Subscribe to RSS Feed
- Permalink
- Report Inappropriate Content
Would you be able to share the qvw with us?
- Mark as New
- Bookmark
- Subscribe
- Mute
- Subscribe to RSS Feed
- Permalink
- Report Inappropriate Content
Yes, Please pay attantion that the expression is just an example, in real life i will use a different one. the idea is to create expression in a text object that simulate a value in a chart.
many thanks
- Mark as New
- Bookmark
- Subscribe
- Mute
- Subscribe to RSS Feed
- Permalink
- Report Inappropriate Content
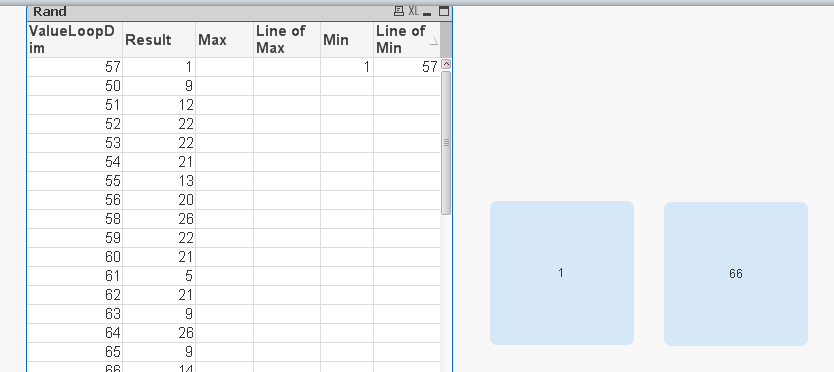
I see the issue now. I think Aggr() only pre-created dimensions which are available in the script. Is it possible to create the ValueLoop() in the script?
Data:
LOAD 49 + IterNo() as ValueLoopDim,
0.5 * Rand() as Rand
AutoGenerate 1
While IterNo() <= 101;