Unlock a world of possibilities! Login now and discover the exclusive benefits awaiting you.
- Qlik Community
- :
- All Forums
- :
- QlikView App Dev
- :
- Re: comparing a value with a list of values in cha...
- Subscribe to RSS Feed
- Mark Topic as New
- Mark Topic as Read
- Float this Topic for Current User
- Bookmark
- Subscribe
- Mute
- Printer Friendly Page
- Mark as New
- Bookmark
- Subscribe
- Mute
- Subscribe to RSS Feed
- Permalink
- Report Inappropriate Content
comparing a value with a list of values in chart expression
Hi all,
I have a chart that calculates a value using aggr and avg functions. I need to compare this value to a set of another values in a table and show a rank value.
For eg:
Value calculated is say 89.19
Table
Values, Rank
80.3, 1
80.6,2
80.9,3
....
88.9 15
89.3 16
and so on. So my value should compare this table and since it falls between Rank 15 and 16 it should take the minimum rank out of it.
I need to use this expression in a line chart. Can someone help me.
Thanks in Advance.
- Mark as New
- Bookmark
- Subscribe
- Mute
- Subscribe to RSS Feed
- Permalink
- Report Inappropriate Content
Would you be able to share a sample to show what exactly you have?
- Mark as New
- Bookmark
- Subscribe
- Mute
- Subscribe to RSS Feed
- Permalink
- Report Inappropriate Content
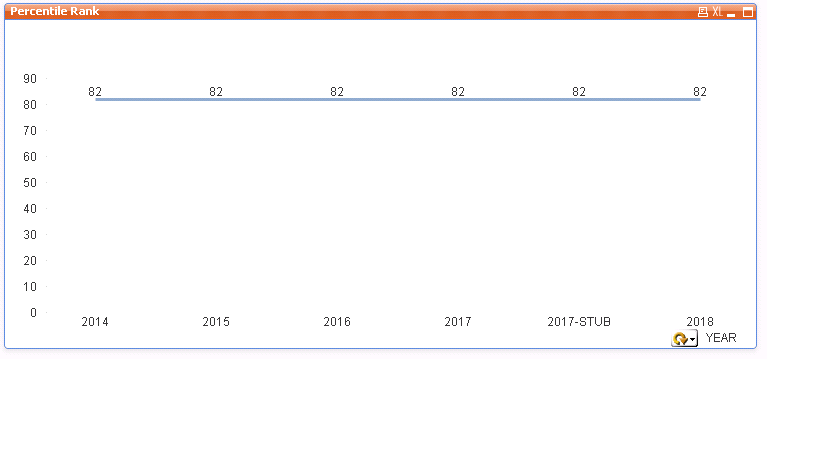
I somehow populated the chart using set analysis but the issue now is that the values are not changing based on dimension.
now how i can make the value respond based on the dimension.
Expression:=max({<Goal<=avg(aggr(avg(aggr(avg(Score),subsection,department,dategroup))department,dategroup))>}Percentile_Rank)
Dimension :dategroup (cyclic group with month,quarter and year)
Thanks in advance
- Mark as New
- Bookmark
- Subscribe
- Mute
- Subscribe to RSS Feed
- Permalink
- Report Inappropriate Content
since you have aggr() function only the dimension with the aggr function will get reflected ...currently its will react for
subsection,department,dategroup
- Mark as New
- Bookmark
- Subscribe
- Mute
- Subscribe to RSS Feed
- Permalink
- Report Inappropriate Content
yes i understand that but the values are not changing for the Dategroup which is mentioned in the AGGR function.
- Mark as New
- Bookmark
- Subscribe
- Mute
- Subscribe to RSS Feed
- Permalink
- Report Inappropriate Content
Share the sample app will check and let you know
- Mark as New
- Bookmark
- Subscribe
- Mute
- Subscribe to RSS Feed
- Permalink
- Report Inappropriate Content
Your expression looks completely out of order, I wonder how it is even working. Besides, it will be very difficult to say what you would need without having a look at what you have got. Would you be able to share a sample?
- Mark as New
- Bookmark
- Subscribe
- Mute
- Subscribe to RSS Feed
- Permalink
- Report Inappropriate Content
sorry i have QV in my Client machine and would not be able to share a sample app.