Unlock a world of possibilities! Login now and discover the exclusive benefits awaiting you.
- Qlik Community
- :
- All Forums
- :
- QlikView App Dev
- :
- heat map
- Subscribe to RSS Feed
- Mark Topic as New
- Mark Topic as Read
- Float this Topic for Current User
- Bookmark
- Subscribe
- Mute
- Printer Friendly Page
- Mark as New
- Bookmark
- Subscribe
- Mute
- Subscribe to RSS Feed
- Permalink
- Report Inappropriate Content
heat map
hi,
how can i change the color of the blocks of heat map according to my data....like for the larger region a particular color the for the value less than that different colour of lighter shade like that
- Mark as New
- Bookmark
- Subscribe
- Mute
- Subscribe to RSS Feed
- Permalink
- Report Inappropriate Content
Suggest you might use the ARGB function
- Mark as New
- Bookmark
- Subscribe
- Mute
- Subscribe to RSS Feed
- Permalink
- Report Inappropriate Content
ya i can but where i can write rgb function
- Mark as New
- Bookmark
- Subscribe
- Mute
- Subscribe to RSS Feed
- Permalink
- Report Inappropriate Content
If you look in chart properties, Expressions, then expand the tree node next to your expression on the left, then select Background colour - you can then use RGB or ARGB in the Definition box.
- Mark as New
- Bookmark
- Subscribe
- Mute
- Subscribe to RSS Feed
- Permalink
- Report Inappropriate Content

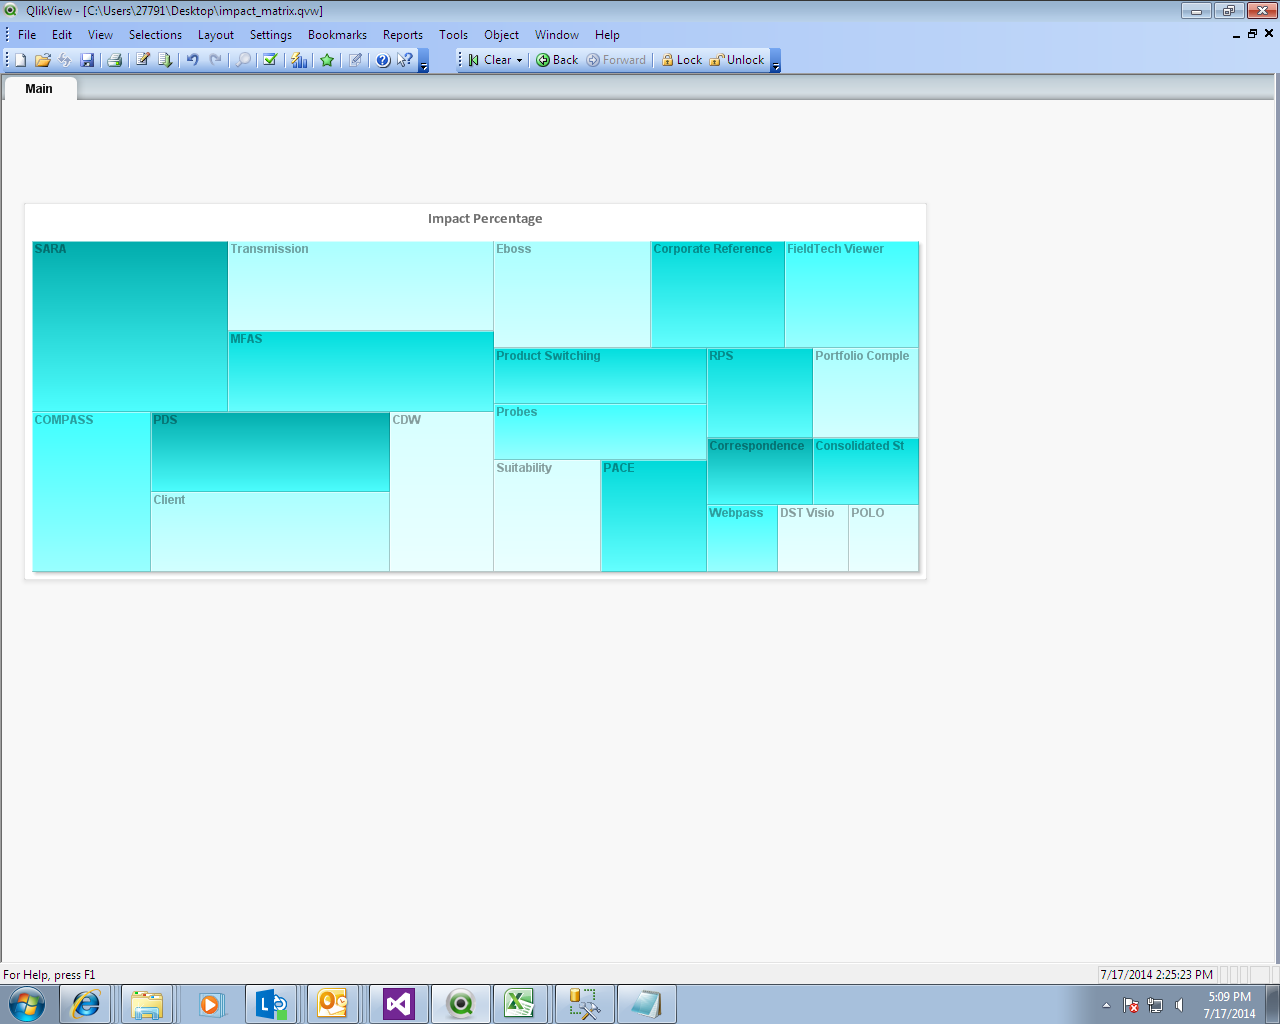
hi this is my chart now its area is the percentage so now i want to show the area with higher percentage with dark colour and so on lighter colour
- Mark as New
- Bookmark
- Subscribe
- Mute
- Subscribe to RSS Feed
- Permalink
- Report Inappropriate Content
Dear Darshika,
You can make the the change in the expression tab, by expanding the expression option. Please see screen print attached.
Regards
R
- Mark as New
- Bookmark
- Subscribe
- Mute
- Subscribe to RSS Feed
- Permalink
- Report Inappropriate Content
Hi Darshika
In Expressions Tab (as mentioned by Rahul) you can use ColorMix Wizard (Edit Expression, File, Colormix Wizard).