Unlock a world of possibilities! Login now and discover the exclusive benefits awaiting you.
- Qlik Community
- :
- All Forums
- :
- QlikView App Dev
- :
- Re: how to create this advance radar chart?
- Subscribe to RSS Feed
- Mark Topic as New
- Mark Topic as Read
- Float this Topic for Current User
- Bookmark
- Subscribe
- Mute
- Printer Friendly Page
- Mark as New
- Bookmark
- Subscribe
- Mute
- Subscribe to RSS Feed
- Permalink
- Report Inappropriate Content
how to create this advance radar chart?
Hi guys,
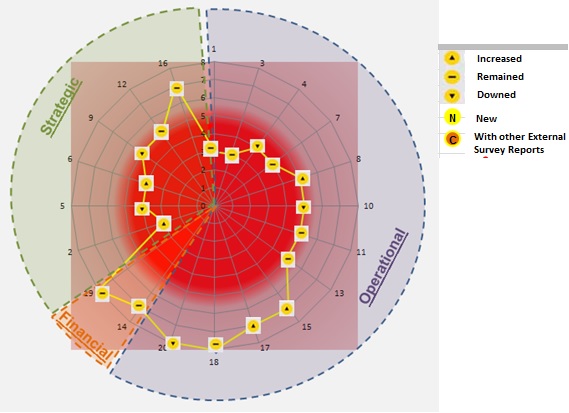
i am working on risk management dashboard. Client has proposed an advanced radar chart to me, whether i could create it in QlikView or not.
Have a look guys, the image is as below.
1) From what I have can see from this chart. It looks like I can create 1 pie chart - operational, strategic, and financial. Then overlay it on top on the radar chart.
Possible guys?
2) On the radar chart, instead of displaying points/dots , how can i show it with icons(increased, remained,downed. new, with other....)
Guys, i do not have any data or sample qvw that i can post it up now. I hope you guys can give me some suggestions and examples , if you have done similar stuffs before.
Rgds,
Jim
- « Previous Replies
-
- 1
- 2
- Next Replies »
- Mark as New
- Bookmark
- Subscribe
- Mute
- Subscribe to RSS Feed
- Permalink
- Report Inappropriate Content
Hi,
one solution regarding the symbols could be:
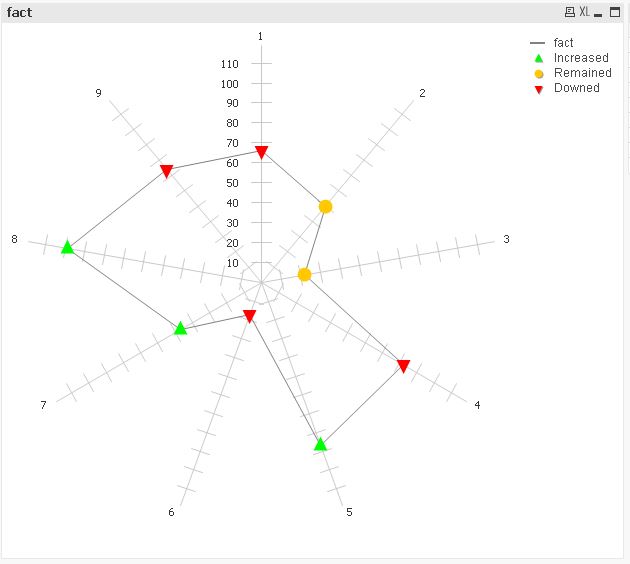
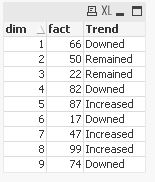
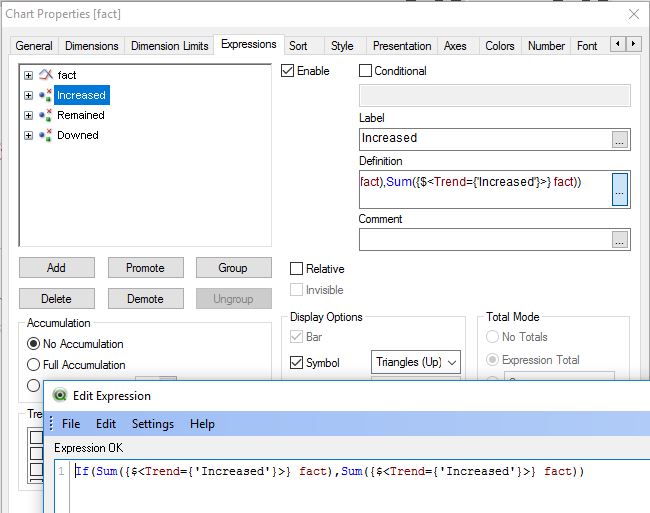
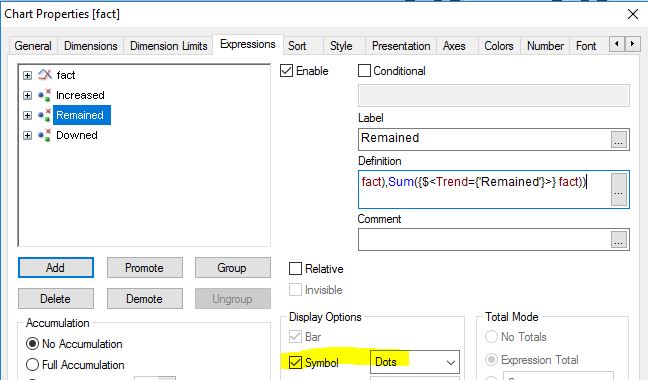
hope this helps
regards
Marco
- Mark as New
- Bookmark
- Subscribe
- Mute
- Subscribe to RSS Feed
- Permalink
- Report Inappropriate Content
Dear Marco,
thanks!!! never thought of creating all these with separate expression. will keep this!
thank you so much!!!
Rgds,
Jim
- Mark as New
- Bookmark
- Subscribe
- Mute
- Subscribe to RSS Feed
- Permalink
- Report Inappropriate Content
You're welcome.
Glad I could help.
please take some time and close your thread if your question is answered:
Qlik Community Tip: Marking Replies as Correct or Helpful
thanks
regards
Marco
- « Previous Replies
-
- 1
- 2
- Next Replies »