Unlock a world of possibilities! Login now and discover the exclusive benefits awaiting you.
- Qlik Community
- :
- All Forums
- :
- QlikView App Dev
- :
- pivote table top 5 Emp count, Location and departm...
- Subscribe to RSS Feed
- Mark Topic as New
- Mark Topic as Read
- Float this Topic for Current User
- Bookmark
- Subscribe
- Mute
- Printer Friendly Page
- Mark as New
- Bookmark
- Subscribe
- Mute
- Subscribe to RSS Feed
- Permalink
- Report Inappropriate Content
pivote table top 5 Emp count, Location and department wise
HI all,
I have Two dimensions in Pivote table like Location,Depatment . In that i need Each and Every Location wise top 5 Department should be presented as dimension in pivote table.and what i need is top 5 Employees count is the Expression in pivote table.if any one having soluation pls help me.
locations are there 20 and 50 Departments there .
Output is need like this and it should be pivote table pls help me.
| Location | Department | Top 5(This is Expression) =count(Employeeid) |
|---|---|---|
| usa | sales | 92 |
| usa | accounts | 75 |
| usa | research | 50 |
| usa | it | 40 |
| usa | R&D | 30 |
| uk | accounts | 150 |
| uk | doctors | 100 |
| uk | associative | 79 |
| uk | sales | 60 |
| uk | R&D | 40 |
- « Previous Replies
-
- 1
- 2
- Next Replies »
Accepted Solutions
- Mark as New
- Bookmark
- Subscribe
- Mute
- Subscribe to RSS Feed
- Permalink
- Report Inappropriate Content
HI c vr,
Please find the attachment.
Hope this will solve ur Problem.
Regards,
Nirav Bhimani
- Mark as New
- Bookmark
- Subscribe
- Mute
- Subscribe to RSS Feed
- Permalink
- Report Inappropriate Content
count({<Location={"=rank(only(Departments)<=$(=vTop)"}>}employe)
Where set vTop=5 in variable, so that it will give you correct result. In place of customer add ur dimension which u want.
or you can try this:
AGGR ( count({<Location={"=only(Departments)<=$(=vTop)"}>}employee),,location,department)
- Mark as New
- Bookmark
- Subscribe
- Mute
- Subscribe to RSS Feed
- Permalink
- Report Inappropriate Content
it is not working friend
- Mark as New
- Bookmark
- Subscribe
- Mute
- Subscribe to RSS Feed
- Permalink
- Report Inappropriate Content
are you tried to get top 5 department and employee also?
- Mark as New
- Bookmark
- Subscribe
- Mute
- Subscribe to RSS Feed
- Permalink
- Report Inappropriate Content
i am trying top 5 departments and respective of Employe count.department is a dimension and employee count is Expression..
- Mark as New
- Bookmark
- Subscribe
- Mute
- Subscribe to RSS Feed
- Permalink
- Report Inappropriate Content
help me out for this soluation, if any one knows this
- Mark as New
- Bookmark
- Subscribe
- Mute
- Subscribe to RSS Feed
- Permalink
- Report Inappropriate Content
HI c vr,
Please find the attachment.
Hope this will solve ur Problem.
Regards,
Nirav Bhimani
- Mark as New
- Bookmark
- Subscribe
- Mute
- Subscribe to RSS Feed
- Permalink
- Report Inappropriate Content
Hi Cvr,
Try this, i hope this will help you,
Attached the Qvw also..
Filtering only top 3 records, you can use a variable instead of value 4..
Note : select Suppress when value is null in the dimension (department)
- Mark as New
- Bookmark
- Subscribe
- Mute
- Subscribe to RSS Feed
- Permalink
- Report Inappropriate Content
Greate work friend,thank u very much.....................
- Mark as New
- Bookmark
- Subscribe
- Mute
- Subscribe to RSS Feed
- Permalink
- Report Inappropriate Content
Dear Nirav,
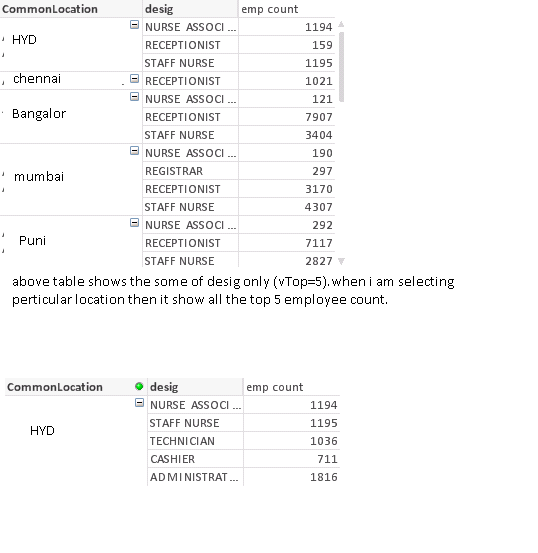
i worked on in your test.qvw after changes it shows like this.
the first table without selection HYD show the desig 3 only .Vtop=5.
Table 2 show the after selection it shows the Top 5 count. but without selection its did't shows the top 5 Emp count hear Nirav

- « Previous Replies
-
- 1
- 2
- Next Replies »