Unlock a world of possibilities! Login now and discover the exclusive benefits awaiting you.
- Qlik Community
- :
- All Forums
- :
- QlikView App Dev
- :
- Re: show percents in pie chart
- Subscribe to RSS Feed
- Mark Topic as New
- Mark Topic as Read
- Float this Topic for Current User
- Bookmark
- Subscribe
- Mute
- Printer Friendly Page
- Mark as New
- Bookmark
- Subscribe
- Mute
- Subscribe to RSS Feed
- Permalink
- Report Inappropriate Content
show percents in pie chart
Hi
Please Help me in displaying the percentages in the pie chart according to the value
Thank you
Accepted Solutions
- Mark as New
- Bookmark
- Subscribe
- Mute
- Subscribe to RSS Feed
- Permalink
- Report Inappropriate Content
Hi Ganesh,
Option 1:
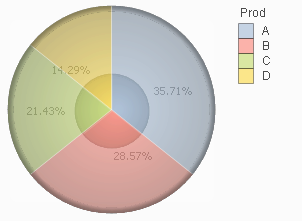
place your inner chart at the bottom layer(make sure your inner chart should be small but you are able to view the proper % values) and then place you original chart over that.
make the colours of your original chart little bit transparent you result will be look like following chart.
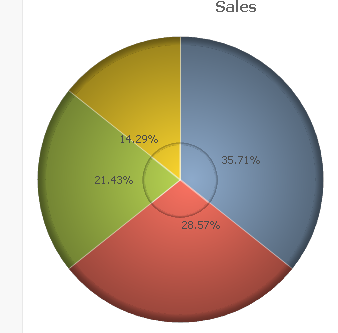
Option 2:
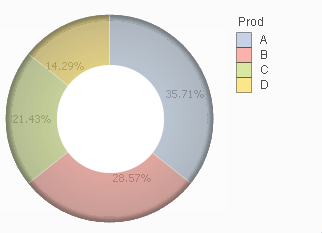
place your inner chart at the Layer 1 (make sure your inner chart should be small but you are able to view the proper % values) .Then crate on rounded text box which looks like circle with white colour and with same size of inner chart. Place that text box on inner chart at layer 2 to cover the plot area.
then make the colours of your original chart little bit transparent you result will be look like following chart .
Hope this will help you....!!
Regards,
Sandip Satbhai
- Mark as New
- Bookmark
- Subscribe
- Mute
- Subscribe to RSS Feed
- Permalink
- Report Inappropriate Content
Hi,
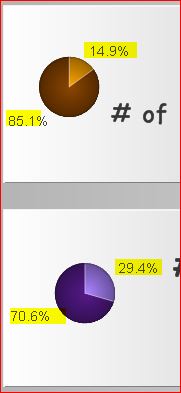
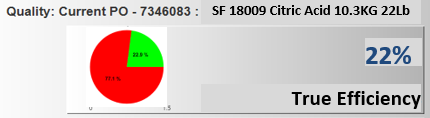
Do you want like the below screen shot? check the attachment.
- Mark as New
- Bookmark
- Subscribe
- Mute
- Subscribe to RSS Feed
- Permalink
- Report Inappropriate Content
you could add one more expression like sum(amount) and check the relative option in the expression tab ...
- Mark as New
- Bookmark
- Subscribe
- Mute
- Subscribe to RSS Feed
- Permalink
- Report Inappropriate Content
- Mark as New
- Bookmark
- Subscribe
- Mute
- Subscribe to RSS Feed
- Permalink
- Report Inappropriate Content
There is no direct option to achieve this. You can do this by using below steps:
1) clone the chart.
2) make the copy smaller.
3) make everything transparent except the data labels.
4) lay the copied chart on top of the original.
- Mark as New
- Bookmark
- Subscribe
- Mute
- Subscribe to RSS Feed
- Permalink
- Report Inappropriate Content
Hi Ganesh,
As mentioned by SANDIPSATBHAI, there is no direct option to display the %value inside the Pie chart. May be you can follow his suggestion.
- Mark as New
- Bookmark
- Subscribe
- Mute
- Subscribe to RSS Feed
- Permalink
- Report Inappropriate Content
Thanks for the quick reply friends SANDIPSATBHAI settu_periasamy
But, I am unable to
make the chart transparent except data labels. I tried to make the size of the cloned chart too small and chart disappeared but percentages are not clear, means 85% is appearing as 5%
could you pls help me with this
Thanks again
- Mark as New
- Bookmark
- Subscribe
- Mute
- Subscribe to RSS Feed
- Permalink
- Report Inappropriate Content
Hi Ganesh,
Option 1:
place your inner chart at the bottom layer(make sure your inner chart should be small but you are able to view the proper % values) and then place you original chart over that.
make the colours of your original chart little bit transparent you result will be look like following chart.
Option 2:
place your inner chart at the Layer 1 (make sure your inner chart should be small but you are able to view the proper % values) .Then crate on rounded text box which looks like circle with white colour and with same size of inner chart. Place that text box on inner chart at layer 2 to cover the plot area.
then make the colours of your original chart little bit transparent you result will be look like following chart .
Hope this will help you....!!
Regards,
Sandip Satbhai
- Mark as New
- Bookmark
- Subscribe
- Mute
- Subscribe to RSS Feed
- Permalink
- Report Inappropriate Content
Thank you very much bhayya