Unlock a world of possibilities! Login now and discover the exclusive benefits awaiting you.
- Qlik Community
- :
- All Forums
- :
- QlikView App Dev
- :
- Re: shows the data exclude from selection
- Subscribe to RSS Feed
- Mark Topic as New
- Mark Topic as Read
- Float this Topic for Current User
- Bookmark
- Subscribe
- Mute
- Printer Friendly Page
- Mark as New
- Bookmark
- Subscribe
- Mute
- Subscribe to RSS Feed
- Permalink
- Report Inappropriate Content
shows the data exclude from selection
hello everyone,
I have a task where I have to exclude selected data.
for example I have two tables like
production_item production_year
A 2011
B 2010
C 2008
D 2009
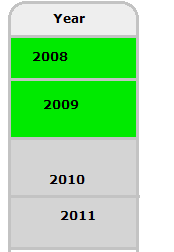
Now I have to exclude item of selected year like

thank you in advance
- « Previous Replies
- Next Replies »
Accepted Solutions
- Mark as New
- Bookmark
- Subscribe
- Mute
- Subscribe to RSS Feed
- Permalink
- Report Inappropriate Content
Here is an example of how you might handle that:
=if(isnull(GetFieldSelections(production_year))<>-1,Only({1-$} DISTINCT production_item), Only({$} DISTINCT production_item))
- Mark as New
- Bookmark
- Subscribe
- Mute
- Subscribe to RSS Feed
- Permalink
- Report Inappropriate Content
Please elaborate more in chart you want this or in table load .
- Mark as New
- Bookmark
- Subscribe
- Mute
- Subscribe to RSS Feed
- Permalink
- Report Inappropriate Content
Use set.
e.g. if u want to get the count of production_item ignoring the selecting it is something like,
count({<production_year=>}production_item)
- Mark as New
- Bookmark
- Subscribe
- Mute
- Subscribe to RSS Feed
- Permalink
- Report Inappropriate Content
You can use E() in the set analysis in your expression.
Example:
=sum({<production_year=E(production_year)>}Value)
- Mark as New
- Bookmark
- Subscribe
- Mute
- Subscribe to RSS Feed
- Permalink
- Report Inappropriate Content
If what you want is to not show the grey items in the list box, you cam check "Hide Excluded" in its properties.
- Mark as New
- Bookmark
- Subscribe
- Mute
- Subscribe to RSS Feed
- Permalink
- Report Inappropriate Content
Hi Bhawna,
If you Year= in excludes/doesn't considers the selection of the Year field
count({<production_year=>}production_item)
or
count({<production_year={'*'}>}production_item)
Hope this what you expect, if you are not expecting this come up with a sample and expected results.
Regards,
Jagan.
- Mark as New
- Bookmark
- Subscribe
- Mute
- Subscribe to RSS Feed
- Permalink
- Report Inappropriate Content
Thanks to everyone for replying,but I didnt get the actual solution,
I have to show only those Production Item of that year which is not selected,means as I have selected 2008 and 2009,
then the chart must show production item of year 2010 and 2011,please help me out this
- Mark as New
- Bookmark
- Subscribe
- Mute
- Subscribe to RSS Feed
- Permalink
- Report Inappropriate Content
I used the sample table u provided and came up with this
=Only({<production_year={'*'}-{$(=GetFieldSelections(production_year))}>}production_item)
This should give you an idea of how to omit the selection and give the rest.
Please let me know.
- Mark as New
- Bookmark
- Subscribe
- Mute
- Subscribe to RSS Feed
- Permalink
- Report Inappropriate Content
What will GetFieldSelections() function do?
and this script doesnt show any result,no data is display.
- Mark as New
- Bookmark
- Subscribe
- Mute
- Subscribe to RSS Feed
- Permalink
- Report Inappropriate Content
it brings back the selected value of the field you specified. In this case it is production_year.I attached the sample that I used below.
- « Previous Replies
- Next Replies »