Unlock a world of possibilities! Login now and discover the exclusive benefits awaiting you.
- Qlik Community
- :
- All Forums
- :
- QlikView App Dev
- :
- Re: stacked and combo chart
- Subscribe to RSS Feed
- Mark Topic as New
- Mark Topic as Read
- Float this Topic for Current User
- Bookmark
- Subscribe
- Mute
- Printer Friendly Page
- Mark as New
- Bookmark
- Subscribe
- Mute
- Subscribe to RSS Feed
- Permalink
- Report Inappropriate Content
stacked and combo chart
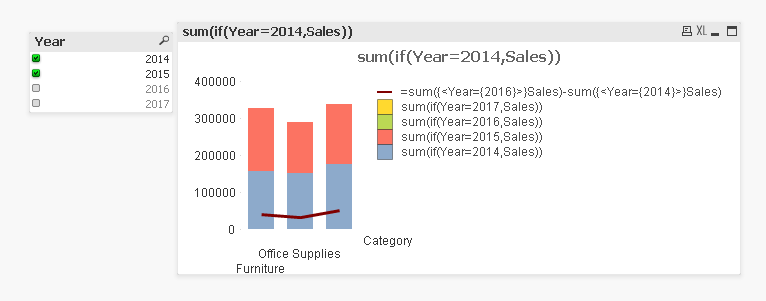
i want graph like this but the years in line chart is not changing dynamically so i have created manual but its not sufficient i want to change it as dynamically please suggest and i have category as dimension and in expressions are shown in below image i make selections on 2014 and 2015 compare the sales and show the difference in line chart te
te
- Mark as New
- Bookmark
- Subscribe
- Mute
- Subscribe to RSS Feed
- Permalink
- Report Inappropriate Content
Can you change your Line expression like below
Sum(Sales) - Above(Sum(Sales))
- Mark as New
- Bookmark
- Subscribe
- Mute
- Subscribe to RSS Feed
- Permalink
- Report Inappropriate Content
Would you be able to share a sample app to see what you have?
- Mark as New
- Bookmark
- Subscribe
- Mute
- Subscribe to RSS Feed
- Permalink
- Report Inappropriate Content
load * inline [Sales, Category, Year
100,furniture,2014
220,furniture,2015
330,furniture,2016
33,furniture,2017
100,powder,2014
220,powder,2015
330,powder,2016
33,powder,2017];
this data is enough and dimension is category and expression is shown in above image
- Mark as New
- Bookmark
- Subscribe
- Mute
- Subscribe to RSS Feed
- Permalink
- Report Inappropriate Content
Is there a maximum number of years you will show? Like 4 years maximum at a time?
- Mark as New
- Bookmark
- Subscribe
- Mute
- Subscribe to RSS Feed
- Permalink
- Report Inappropriate Content
its example data
- Mark as New
- Bookmark
- Subscribe
- Mute
- Subscribe to RSS Feed
- Permalink
- Report Inappropriate Content
I know ![]()
- Mark as New
- Bookmark
- Subscribe
- Mute
- Subscribe to RSS Feed
- Permalink
- Report Inappropriate Content
Hello,
Maybe this will help you:
sum({<Year={"$(=max(Year))"}>}Sales) -sum({< Year-={"$(=max(Year))"}> * <Year=P(Year)>}Sales)
it takes the max year from your selection in the first expression and for the other makes the sum for all years in your selection excluding the max year (which is calculated in the first expression) and t's dynamical
Hope it helps,
Andrei
- Mark as New
- Bookmark
- Subscribe
- Mute
- Subscribe to RSS Feed
- Permalink
- Report Inappropriate Content
Hi,
maybe the answers in your other thread regarding this question are helpful?
Please also review your open threads and close those who received correct answers:
Qlik Community Tip: Marking Replies as Correct or Helpful
thanks
regards
Marco