Unlock a world of possibilities! Login now and discover the exclusive benefits awaiting you.
- Qlik Community
- :
- All Forums
- :
- QlikView App Dev
- :
- Re: sum function
- Subscribe to RSS Feed
- Mark Topic as New
- Mark Topic as Read
- Float this Topic for Current User
- Bookmark
- Subscribe
- Mute
- Printer Friendly Page
- Mark as New
- Bookmark
- Subscribe
- Mute
- Subscribe to RSS Feed
- Permalink
- Report Inappropriate Content
sum function
Hi,
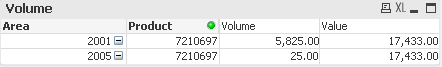
I've an issue with the value column on my report.
The first line should be 17,433 - which is showing the value of in Area 2001
The second line however should read 74.50
I'm using the function - sum(TotalValue) but this is obviously using the total value and applying it to each colunm.
Whats the best way to have the appropriate Value being shown for each line/Area?
Thanks
- Mark as New
- Bookmark
- Subscribe
- Mute
- Subscribe to RSS Feed
- Permalink
- Report Inappropriate Content
Try using aggr function.Something like sum(aggr(sum(value),product,Area)
- Mark as New
- Bookmark
- Subscribe
- Mute
- Subscribe to RSS Feed
- Permalink
- Report Inappropriate Content
using sum(distinct value)
- Mark as New
- Bookmark
- Subscribe
- Mute
- Subscribe to RSS Feed
- Permalink
- Report Inappropriate Content
I suspect you use
Sum( Total Value )
when you should use
Sum( Value )
The "Total" is a keyword that makes QlikView display the total of the chart. Not the line.
HIC
- Mark as New
- Bookmark
- Subscribe
- Mute
- Subscribe to RSS Feed
- Permalink
- Report Inappropriate Content
Im basically linking 2 tables together,
Table A Table B
-Material -Material
-Total Value -Area
-Volume
The 'Volume' figure is correct as there are a number of Materials in different Areas
However, when I join the tables, the Total Value distinguish which Area the Material comes from, and thus gives me an incorrect figure.
Hope this makes sense!
- Mark as New
- Bookmark
- Subscribe
- Mute
- Subscribe to RSS Feed
- Permalink
- Report Inappropriate Content
hi try this
instead of uisng sum use in the expression as total value-->field name
get rid of sum....