Unlock a world of possibilities! Login now and discover the exclusive benefits awaiting you.

Announcements
Talend Cloud AWS EU Scheduled Outage: Starting Tues 26 May 21:00 CEST with expected completion Wed 27 May 01:00 CEST
- Qlik Community
- :
- All Forums
- :
- QlikView
- :
- yearly sales
Options
- Subscribe to RSS Feed
- Mark Topic as New
- Mark Topic as Read
- Float this Topic for Current User
- Bookmark
- Subscribe
- Mute
- Printer Friendly Page
Turn on suggestions
Auto-suggest helps you quickly narrow down your search results by suggesting possible matches as you type.
Showing results for

Anonymous
Not applicable
2017-11-17
02:29 AM
- Mark as New
- Bookmark
- Subscribe
- Mute
- Subscribe to RSS Feed
- Permalink
- Report Inappropriate Content
yearly sales
hello everyone,
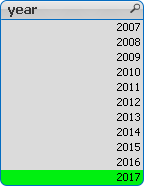
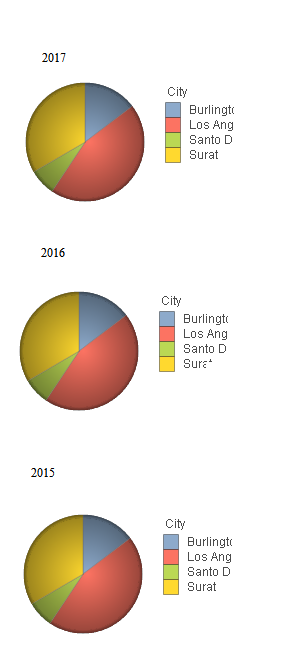
i come to know ,when i select on 2017 years it will shows last three years of data in three different pie chart like below.
How it will be possible?
for eg.
579 Views
1 Solution
Accepted Solutions

 tresB
tresB
Champion III
2017-11-17
02:33 AM
- Mark as New
- Bookmark
- Subscribe
- Mute
- Subscribe to RSS Feed
- Permalink
- Report Inappropriate Content
Try like:
Chart1 Exp: = Sum({<year={'$(=Max(year))'}>}Sales)
Chart2 Exp: = Sum({<year={'$(=Max(year)-1)'}>}Sales)
Chart3 Exp: = Sum({<year={'$(=Max(year)-2)'}>}Sales)
2 Replies
tresB
Champion III
2017-11-17
02:33 AM
- Mark as New
- Bookmark
- Subscribe
- Mute
- Subscribe to RSS Feed
- Permalink
- Report Inappropriate Content
Try like:
Chart1 Exp: = Sum({<year={'$(=Max(year))'}>}Sales)
Chart2 Exp: = Sum({<year={'$(=Max(year)-1)'}>}Sales)
Chart3 Exp: = Sum({<year={'$(=Max(year)-2)'}>}Sales)
Anonymous
Not applicable
2017-11-17
02:48 AM
Author
- Mark as New
- Bookmark
- Subscribe
- Mute
- Subscribe to RSS Feed
- Permalink
- Report Inappropriate Content
Thanks, It works perfectly.
535 Views