Unlock a world of possibilities! Login now and discover the exclusive benefits awaiting you.
- Qlik Community
- :
- Forums
- :
- Groups
- :
- Industry and Topics
- :
- Scalability
- :
- QV Scalability Tools (QV10,QV11,QV12)
- Subscribe to RSS Feed
- Mark Topic as New
- Mark Topic as Read
- Float this Topic for Current User
- Bookmark
- Subscribe
- Mute
- Printer Friendly Page
- Feature this Topic
- Mark as New
- Bookmark
- Subscribe
- Mute
- Subscribe to RSS Feed
- Permalink
- Report Inappropriate Content
QV Scalability Tools (QV10,QV11,QV12)
This package (referred to as QVScalabilityTools) contains a complete set of tools for easy creation, execution and analyzing of load/performance tests and regression tests.
QlikView documents to help analyze result and log files(This was previously included in this package):Scalability Results Analyzer
Older versions of the tool can be found here: Tool for easy creation of load/performance tests of QlikView (v.10 and 11)
Tools for Qlik Sense can be found here: Qlik Sense Scalability Tools
Note: Using windows built-in unzip functionality will not allow the .exe to launch unless unblocking zipped package first (properties -> unblock).
Note: Regarding Apache Log4j, reference CVE-2021-44228 (also referred to as Log4Shell), these set of tools are not directly vulnerable to the exploit, however JMeter, the tool required as a separate download, is. How to mitigate the vulnerability for JMeter has been documented here : https://community.qlik.com/t5/Knowledge/Qlik-Scalability-tools-and-log4j/ta-p/1872009
Included parts are:
- Standalone application for creating a JMeter script
- Support files for launching the script by utilizing the JMeter engine (JMeter installed is a pre-requisite)
- Documentation on how to use the package
Version 1.2.7->1.2.8
- Changes Section Access requests
Changelog 1.2.6->1.2.7
- NTLM support removed due current solution broken and lack of a new secure solution.
- Small updates for static content, for future product releases.
2019-08-26
Documentation updates due to:
- New recommended JMeter version (4.0)
- Changes to the licensing for the Oracle Java implementation (seehttps://www.oracle.com/technetwork/java/javase/overview/oracle-jdk-faqs.html)
- Open-source Java Development Kits (JDKs) have been verified for use with JMeter and the QlikView Scalability Tools
Changelog 1.2.5->1.2.6
- Added support for QlikView 12.50 and 12.20SR10
Changelog 1.2.4->1.2.5
- Added support for QlikView 12.30
Changelog 1.2.3->1.2.4
- Added support for JMeter 4.0 and Java 9.
- Bugfixes for regression testing
- Added actions: Select Excluded, Select All, Select Possible
- Added support for 12.20 SR3
Changelog 1.2.2->1.2.3
- Bugfix for export to excel action
- Added transfer state (bookmark) support for document chaining
- GUI: Template selection more accurately show supported Qv versions
Changelog 1.2.1->1.2.2
- Bugfixes, make sure minimum amount of selections are respected in certain corner cases
Changelog 1.2->1.2.1
- Improved performance for high throughput scenarios
Changelog 1.1 -> 1.2
- Improved assertions logic to show faulty actions as errors
- Change JMeter template scripts to use groovy instead of beanshell
- New prerequisites:
- JMeter version 3.0
- Java 64-bit JRE 8
Your use of QVScalabilityTools will be subject to the same license agreement between you and QlikTech for QlikView Server. QlikTech does not provide maintenance and support services for QVScalabilityTools, however please check QlikCommunity for additional information on use of these products.
PLEASE NOTE:
The supported versions of Java are 8 and 9. Supported version of JMeter are 3.0 and 4.0, but not 3.2
- Mark as New
- Bookmark
- Subscribe
- Mute
- Subscribe to RSS Feed
- Permalink
- Report Inappropriate Content
Hi,
I am using the latest version of scalability tool.
Secondly I am using JMETER 3.2 .
Please find the attached image.
Please suggest the way through which I can use the tool effectively.
- Mark as New
- Bookmark
- Subscribe
- Mute
- Subscribe to RSS Feed
- Permalink
- Report Inappropriate Content
We have identified some breaking changes between JMeter 3.0 and 3.2
If you're using Jmeter 3.2 please try with Jmeter 3.0 (https://archive.apache.org/dist/jmeter/binaries/apache-jmeter-3.0.zip)
- Mark as New
- Bookmark
- Subscribe
- Mute
- Subscribe to RSS Feed
- Permalink
- Report Inappropriate Content
Hello,
I am using qlik scalabilty tool for the first time , while testing the application on the server I am getting some sort of error in my event logs and session logs due to which I am not able to get the correct results. Though in the scalability tool there is no error.
Please find the attached image of the logs.
- Mark as New
- Bookmark
- Subscribe
- Mute
- Subscribe to RSS Feed
- Permalink
- Report Inappropriate Content
Hi,
The first log picture indicate that you are using named user cals which will be a problem as only one is allowed at a given time so every new user will kill the ongoing session.
From the documenation:
"The default JMeter behavior is to connect to QlikView Server with the NTLM user who started it. This works in some cases, but Named CALs do not accept multiple sessions with different session cookies for the same username and QlikView document. Ensuring that other licenses are used instead might solve this, but there are other options as well. Configuring to use DMS mode and header authentication is one option. The test scenario must then be configured to use Header authentication, with the usernames in a text file. This will ensure that unique users connect and as long as each user is assigned a CAL the simulation will work."
For the second log picture, it is not something I recall to have seen before.
My first advice is to try and simulate a single user, preferably doing so from jmeter so you can see responses better if something fails. Do so by changing number of users to 1, then right clicking on you script in the execution tab and select open in jmeter. Once opened, enable the greyed out component called "View Results Tree" and run the script. The Result tree component will allow you to see all requests and responses, everything that fails will be marked Red in the output.
My second advice is to change to run header authentication if you want to simulate more than one user.
Regards
- Mark as New
- Bookmark
- Subscribe
- Mute
- Subscribe to RSS Feed
- Permalink
- Report Inappropriate Content
Hi Sebastin,
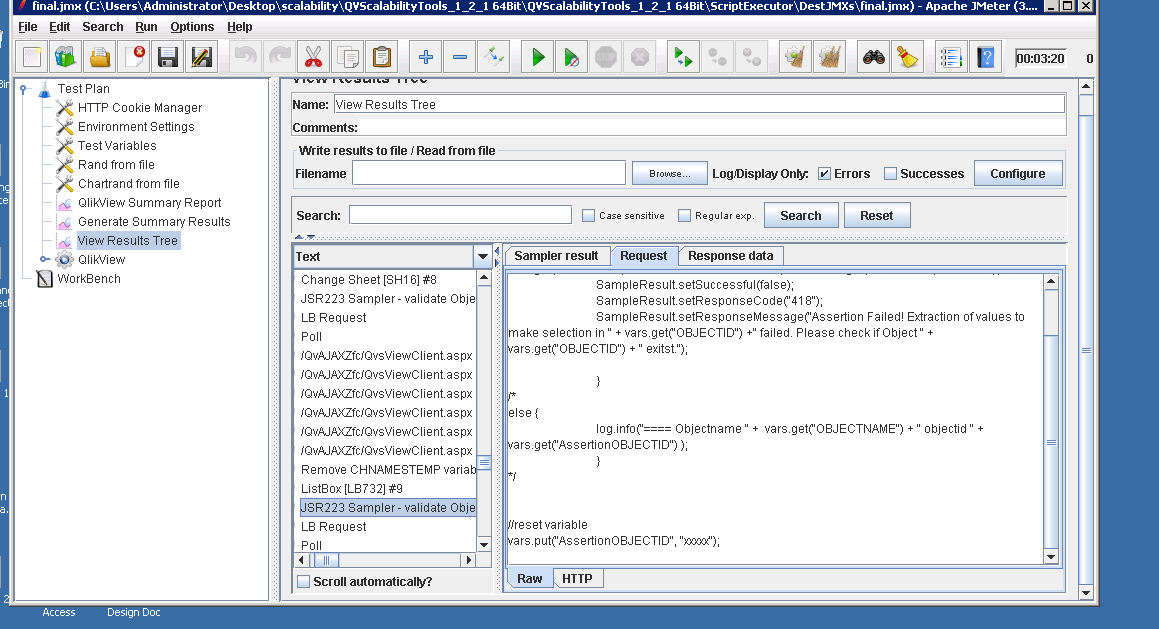
As per your suggestion I ran the script I JMeter. Though nothing is coming in red color(everything is in green) but I found that after each action a new point is coming saying that JSR223 SAMPLER - validate object id.
Please find the attached screenshot of this.

Secondly there is no failing samples in the j meter logs. Please find the logs below
timeStamp,elapsed,label,responseCode,responseMessage,threadName,dataType,success,bytes,grpThreads,allThreads,Latency
1497344786772,17,/qlikview/,200,OK,QlikView 1-1,text,true,5895,1,1,13
1497344786790,2,/qlikview/index.htm,200,OK,QlikView 1-1,text,true,5726,1,1,2
1497344786792,2,/qlikview/images/ajax-loader.gif,200,OK,QlikView 1-1,bin,true,11066,1,1,1
1497344786794,4,/qlikview/js/accessPoint.js,200,OK,QlikView 1-1,text,true,41908,1,1,2
1497344786798,2,/qlikview/js/login.js,200,OK,QlikView 1-1,text,true,4965,1,1,2
1497344786800,1,/qlikview/global.css,200,OK,QlikView 1-1,text,true,19604,1,1,1
1497344786802,1,/qlikview/custom.css,200,OK,QlikView 1-1,text,true,601,1,1,1
1497344786804,6,/qlikview/js/jquery.min.js,200,OK,QlikView 1-1,text,true,96215,1,1,1
1497344786810,3,/qlikview/images/logo_main.png,200,OK,QlikView 1-1,bin,true,9585,1,1,3
1497344786813,1,/qlikview/images/bg_tableHead.png,200,OK,QlikView 1-1,bin,true,5413,1,1,1
1497344786815,1,/qlikview/images/loading_box.png,200,OK,QlikView 1-1,bin,true,6327,1,1,1
1497344786816,1,/qlikview/images/ap_sprite.png,200,OK,QlikView 1-1,bin,true,5689,1,1,1
1497344786818,1,/qlikview/images/rule_filterHead.png,200,OK,QlikView 1-1,bin,true,3814,1,1,1
1497344786819,2,/QvAJAXZfc/AccessPoint.aspx?mark=&platform=browser.gecko.5&dpi=96,200,OK,QlikView 1-1,text,true,544,1,1,2
1497344787007,3,/qlikview/images/logo_accessPoint.png,200,OK,QlikView 1-1,bin,true,2299,1,1,3
1497344787010,1,/qlikview/images/rule_columnHead.png,200,OK,QlikView 1-1,bin,true,3789,1,1,1
1497344787012,1,/qlikview/images/bg_columnHead_off.png,200,OK,QlikView 1-1,bin,true,3789,1,1,1
1497344787013,2,/qlikview/images/bg_body.png,200,OK,QlikView 1-1,bin,true,4863,1,1,2
1497344787015,12,/QvAJAXZfc/Authenticate.aspx,200,OK,QlikView 1-1,text,true,326,1,1,12
1497344787027,42209,/QvAJAXZfc/AccessPoint.aspx?mark=&platform=browser.gecko.5&dpi=96,200,OK,QlikView 1-1,text,true,1365,1,1,42209
1497344829246,3,/qlikview/images/bg_thumb.png,200,OK,QlikView 1-1,bin,true,1275,1,1,3
1497344829587,4,/QvAJAXZfc/AccessPoint.aspx,200,OK,QlikView 1-1,bin,true,18946,1,1,4
1497344786756,42830,Access Point #1,200,"Number of samples in transaction : 22, number of failing samples : 0",QlikView 1-1,,true,254004,1,1,42267
1497344829593,5,/QvAjaxZfc/AccessPoint.aspx,200,OK,QlikView 1-1,text,true,5526,1,1,2
1497344829600,2,/QvAjaxZfc/opendoc.htm,200,OK,QlikView 1-1,text,true,5268,1,1,2
1497344829603,5,/QvAjaxZfc/htc/default.css,200,OK,QlikView 1-1,text,true,37034,1,1,2
1497344829609,75,/QvAjaxZfc/htc/QvAjax.js,200,OK,QlikView 1-1,text,true,349586,1,1,4
1497344829684,6,/QvAjaxZfc/Authenticate.aspx,200,OK,QlikView 1-1,text,true,239,1,1,6
1497344829690,2,/QvAjaxZfc/htc/images/property_sprite.png,200,OK,QlikView 1-1,bin,true,78449,1,1,2
1497344829732,2145,Open Doc Request,200,OK,QlikView 1-1,text,true,2513,1,1,2145
1497344831999,4,/QvAjaxZfc/QvsViewClient.aspx,200,OK,QlikView 1-1,text,true,2063,1,1,4
1497344832151,59,Poll,200,OK,QlikView 1-1,text,true,15478,1,1,53
1497344832349,13,/QvAJAXZfc/QvsViewClient.aspx?mark=40E4F271AF98D76B&host=QVS@vcl-srv-qliknew&view=Primary_Sales_Application.qvw&platform=browser.gecko.3.6&dpi=96&xrfkey=xrfkeyvalue12345,200,OK,QlikView 1-1,text,true,522,1,1,13
1497344832365,3,/QvAjaxZfc/QvsViewClient.aspx,200,OK,QlikView 1-1,bin,true,293,1,1,3
1497344832369,2,/QvAjaxZfc/QvsViewClient.aspx,200,OK,QlikView 1-1,bin,true,293,1,1,2
1497344832371,2,/QvAjaxZfc/QvsViewClient.aspx,200,OK,QlikView 1-1,bin,true,293,1,1,2
1497344832373,2,/QvAjaxZfc/QvsViewClient.aspx,200,OK,QlikView 1-1,bin,true,361,1,1,2
1497344832375,2,/QvAjaxZfc/QvsViewClient.aspx,200,OK,QlikView 1-1,bin,true,312,1,1,1
1497344832377,1,/QvAjaxZfc/QvsViewClient.aspx,200,OK,QlikView 1-1,bin,true,312,1,1,1
1497344832379,2,/QvAjaxZfc/QvsViewClient.aspx,200,OK,QlikView 1-1,bin,true,4700,1,1,2
1497344832381,11,Remove CHNAMESTEMP variables,200,OK,QlikView 1-1,text,true,0,1,1,0
1497344829592,2823,Open Document #2,200,"Number of samples in transaction : 22, number of failing samples : 0",QlikView 1-1,,true,503242,1,1,2246
1497344832423,62,Change sheet Request,200,OK,QlikView 1-1,text,true,1489,1,1,62
1497344832653,96,Poll,200,OK,QlikView 1-1,text,true,17721,1,1,90
1497344832856,13,/QvAJAXZfc/QvsViewClient.aspx,200,OK,QlikView 1-1,bin,true,293,1,1,13
1497344832870,2,/QvAJAXZfc/QvsViewClient.aspx,200,OK,QlikView 1-1,bin,true,293,1,1,2
1497344832872,2,/QvAJAXZfc/QvsViewClient.aspx,200,OK,QlikView 1-1,bin,true,293,1,1,2
1497344832874,2,/QvAJAXZfc/QvsViewClient.aspx,200,OK,QlikView 1-1,bin,true,312,1,1,2
1497344832876,2,/QvAJAXZfc/QvsViewClient.aspx,200,OK,QlikView 1-1,bin,true,312,1,1,2
1497344832878,2,/QvAJAXZfc/QvsViewClient.aspx,200,OK,QlikView 1-1,bin,true,4700,1,1,2
1497344832881,1,/QvAJAXZfc/QvsViewClient.aspx,200,OK,QlikView 1-1,bin,true,312,1,1,1
1497344832882,2,/QvAJAXZfc/QvsViewClient.aspx,200,OK,QlikView 1-1,bin,true,312,1,1,2
1497344832884,2,/QvAJAXZfc/QvsViewClient.aspx,200,OK,QlikView 1-1,bin,true,361,1,1,2
1497344832886,1,Remove CHNAMESTEMP variables,200,OK,QlikView 1-1,text,true,0,1,1,0
1497344832417,470,Change Sheet [SH14] #3,200,"Number of samples in transaction : 15, number of failing samples : 0",QlikView 1-1,,true,26398,1,1,180
1497344832887,13,JSR223 Sampler - validate ObjectID,200,OK,QlikView 1-1,text,true,0,1,1,0
1497344832901,244,LB Request,200,OK,QlikView 1-1,text,true,1817,1,1,244
- Mark as New
- Bookmark
- Subscribe
- Mute
- Subscribe to RSS Feed
- Permalink
- Report Inappropriate Content
Hi,
Sebastian already pointed out that the problem from your first post was connected to setup with NTLM.
The results you've got with the test with one user simulation are the expected ones. From the part of the result file it can be seen that all requests have valid response and that the transaction controllers (which are collection of requests for one action/click) are also not returning any failed request.
The JSR223 SAMPLER - validate ObjectId is part of transaction controller which is an additional validation.
It will fail the sample if you try to make selection in object which does not exist.
If this happens (for example if object in which selection should be made was removed from application) the message "Assertion Failed!" will be present in jmeter results file. Sample and the transaction controller will be set to failed. This will be also indicated by red icon in View Results Tree while running from JMeter GUI or will be showed in error count while running from the QlikView Scalability Tools in the execution tab.
The information from the screen shot (Request) is a script part within the sampler which is validating the ObjectID.
As long as you do not see any errors and everything is green the test run is consider to be successful.
- Mark as New
- Bookmark
- Subscribe
- Mute
- Subscribe to RSS Feed
- Permalink
- Report Inappropriate Content
Hi,
Thanks for your response, as suggested I am using header authentication with the help of fiddler ,
but still in the logs I am facing the same issue as mentioned above.
erver Started Timestamp SeverityID EventID Severity Message
20170510T163543.000+0500 20170510T163544.000+0500 1 300 Error QVGeneral: CQvXmlInterfaceRequestHandler - Catch: errId(-3). Ino(-1). Fno(90)
20170510T163543.000+0500 20170510T164445.000+0500 1 300 Error QVGeneral: CQvXmlInterfaceRequestHandler - Catch: errId(-3). Ino(-1). Fno(90)
20170510T164451.000+0500 20170510T164617.000+0500 1 300 Error QVGeneral: CQvXmlInterfaceRequestHandler - Catch: errId(-3). Ino(-1). Fno(90)
20170510T164642.000+0500 20170510T165618.000+0500 1 300 Error QVGeneral: CQvXmlInterfaceRequestHandler - Catch: errId(-3). Ino(-1). Fno(90)
20170510T164642.000+0500 20170510T170619.000+0500 1 300 Error QVGeneral: CQvXmlInterfaceRequestHandler - Catch: errId(-3). Ino(-1). Fno(90)
20170510T164642.000+0500 20170510T171620.000+0500 1 300 Error QVGeneral: CQvXmlInterfaceRequestHandler - Catch: errId(-3). Ino(-1). Fno(90)
20170510T164642.000+0500 20170510T172621.000+0500 1 300 Error QVGeneral: CQvXmlInterfaceRequestHandler - Catch: errId(-3). Ino(-1). Fno(90)
20170510T164642.000+0500 20170510T173622.000+0500 1 300 Error QVGeneral: CQvXmlInterfaceRequestHandler - Catch: errId(-3). Ino(-1). Fno(90)
20170510T164642.000+0500 20170510T174623.000+0500 1 300 Error QVGeneral: CQvXmlInterfaceRequestHandler - Catch: errId(-3). Ino(-1). Fno(90)
20170510T164642.000+0500 20170510T175624.000+0500 1 300 Error QVGeneral: CQvXmlInterfaceRequestHandler - Catch: errId(-3). Ino(-1). Fno(90)
20170612T132358.000+0500 20170613T142106.000+0500 4 100 Notice CAL usage: Using CAL of type "Named User" for user "VCL-SRV-QLIKNEW\ADMINISTRATOR". Named user cals in use: 1
20170612T132358.000+0500 20170613T142107.000+0500 4 100 Notice CAL usage: Named CAL session for user "VCL-SRV-QLIKNEW\ADMINISTRATOR" stopped
20170612T132358.000+0500 20170613T142107.000+0500 4 100 Notice CAL usage: Using CAL of type "Named User" for user "VCL-SRV-QLIKNEW\ADMINISTRATOR". Named user cals in use: 1
20170612T132358.000+0500 20170613T142108.000+0500 4 100 Notice CAL usage: Named CAL session for user "VCL-SRV-QLIKNEW\ADMINISTRATOR" stopped
20170612T132358.000+0500 20170613T142108.000+0500 4 100 Notice CAL usage: Using CAL of type "Named User" for user "VCL-SRV-QLIKNEW\ADMINISTRATOR". Named user cals in use: 1
20170612T132358.000+0500 20170613T142109.000+0500 4 100 Notice CAL usage: Named CAL session for user "VCL-SRV-QLIKNEW\ADMINISTRATOR" stopped
20170612T132358.000+0500 20170613T155510.000+0500 4 700 Information QVGeneral: MetaService - GetData: Could not get info due to (The system cannot find the file specified.), of document Qlikview/Stage2/LW Mobile Application/QVD Maker/Stage2_Transaction1.qvw
20170612T132358.000+0500 20170613T155510.000+0500 4 700 Information QVGeneral: MetaService - GetData: Could not get info due to (The system cannot find the file specified.), of document Qlikview/Stage2/LW Mobile Application/QVD Maker/Stage2_Transaction2.qvw
20170612T132358.000+0500 20170613T155510.000+0500 4 700 Information Mount: Browsing D:\QLIKVIEW_REVAMP\Stage2\LW Mobile Application\QVDs. User=VCL-SRV-QLIKNEW\Administrator, ImpLev=0
20170612T132358.000+0500 20170613T155510.000+0500 4 700 Information Mount: Browsing D:\QLIKVIEW_REVAMP\Stage3. User=VCL-SRV-QLIKNEW\Administrator, ImpLev=0
20170612T132358.000+0500 20170613T155510.000+0500 4 700 Information Mount: Browsing D:\QLIKVIEW_REVAMP\Stage3\GP. User=VCL-SRV-QLIKNEW\Administrator, ImpLev=0
20170612T132358.000+0500 20170613T155510.000+0500 4 700 Information Mount: Browsing D:\QLIKVIEW_REVAMP\Stage3\GP\BKP. User=VCL-SRV-QLIKNEW\Administrator, ImpLev=0
Though in the jmeter execution there is no error except a warning JSR223 SAMPLER - validate ObjectId .
One more thing when I use the result analyzer to make the results with the help of the logs I get session and response time charts but the CPU Calculation engine, RAM Calculation engine charts and some other charts are not generated.
Please Note :I have already put the server logs in the desired folder.
- Mark as New
- Bookmark
- Subscribe
- Mute
- Subscribe to RSS Feed
- Permalink
- Report Inappropriate Content
Hi,
Couple of questions:
- Have you set up the header authentication in the QV Scalability Tool? (this is described in documentation pages 11 and 12)
- You mentioned fiddler how are you using it?
- In the previous post you mentioned that everything was green - so what exactly is the warning from JSR223 SAMPLER - validate ObjectId?
- Which web server are you using: IIS or QV Web Server?
As long as this request in the sampler result presents response code: 200 and response message: OK everything is fine, and there is nothing to worry about.
The errors from the beginning of the event log you pasted are most probably connected with authentication.
What does the session.log say for the time of the test? Were there any session created?
==============
SC Results Analyzer
There are two main suspects why you might not see the graphs for CPU and RAM usage.
1. Timezone - When using the QVD generator - you have to select the proper timezone from drop down list.
2. The TestLogMeta.txt does not contain proper information.
The PerfromanceCounters (ServerLogs) are based on machine name. The values are automatically populated with part of the URL to the document that was used in the script.
If fully qualified domain name was used (i.e. http://myserver.in.my.domain.com/....) the file will contain "myserver.in.my.domain.com" since the performance counters are based on machine name this should be edited and change to "myserver" only.
Two examples of TestLogMeta.txt files:
Original after running QVD generator:
After necessary modifications:
This is also described in the documentation 'User Guide for SC Results Analyzer' pages 5 and 6.
- Mark as New
- Bookmark
- Subscribe
- Mute
- Subscribe to RSS Feed
- Permalink
- Report Inappropriate Content
Hi ,
Firstly thanks for your reply.
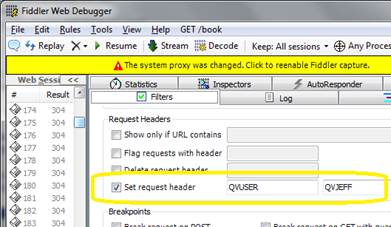
Yes, I am using header authentication and using it with the help of fiddler tool.
By directly launching the fiddler and and set request header in the filter option the header authentication is activated . Please find the below screenshot of the above.


I am using QV Web Server.
In the JSR223 SAMPLER - validate ObjectId the ampler result presents response code: 200 and response message: OK only , so as you mentioned there is no need to worry about.
I also feel that there is something missing in the authorization part only.
As far as the session logs are concerned I don't think the sessions were created. It is showing the warning regularly that Killed because Named User Cal was needed from another client
Please finnd the attached image of the logs :
In the CPU and RAM charts the timezone used by me is correct and the TestLogMeta.txt is also using the correct server name as pointed by you.
- Mark as New
- Bookmark
- Subscribe
- Mute
- Subscribe to RSS Feed
- Permalink
- Report Inappropriate Content
Hi,
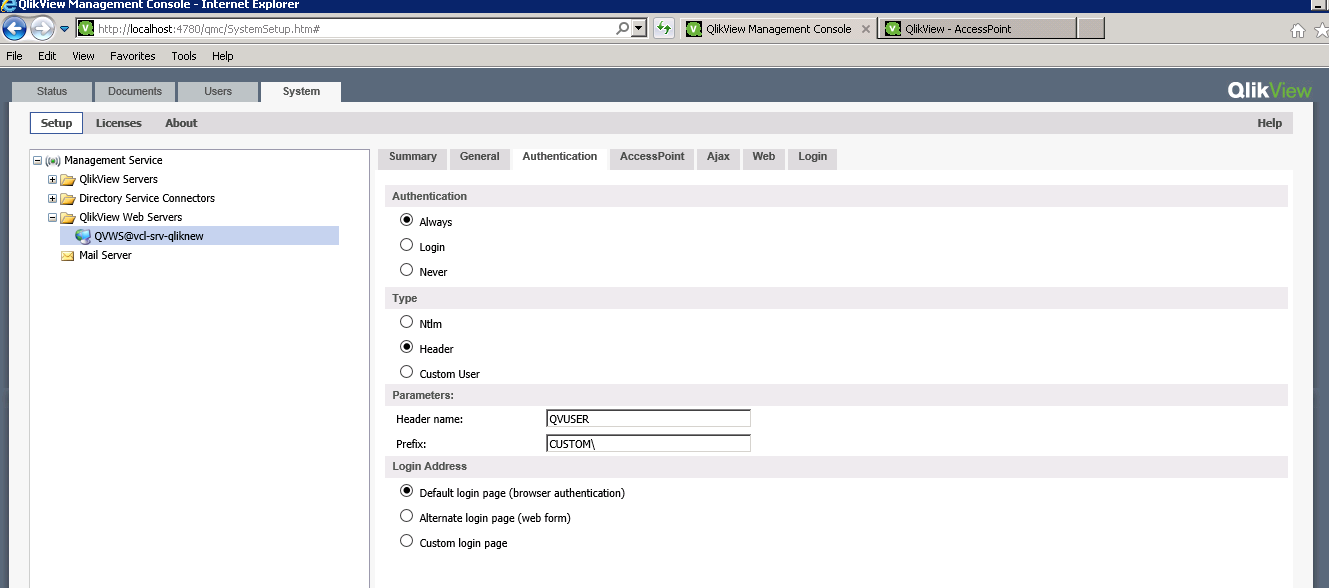
Header authentication looks good from the QMC perspectice but how is it setup in the tool? Due to the logs ("Killed because Named User Cal was needed from another client") you posted it seems that the scalability tool is running as your NTLM user. As only 1 named cal session can be used at a time, every time a new simulated user is created it kills the active session.
As for the analyzer, hard to tell what is wrong but you could alway open the performance counter logs and double check that it contains data, for example if there is CPU data logged from the QVS service.