Unlock a world of possibilities! Login now and discover the exclusive benefits awaiting you.
- Qlik Community
- :
- Forums
- :
- Analytics & AI
- :
- Products & Topics
- :
- Visualization and Usability
- :
- Apply selections or filter data based on 2 dates
- Subscribe to RSS Feed
- Mark Topic as New
- Mark Topic as Read
- Float this Topic for Current User
- Bookmark
- Subscribe
- Mute
- Printer Friendly Page
- Mark as New
- Bookmark
- Subscribe
- Mute
- Subscribe to RSS Feed
- Permalink
- Report Inappropriate Content
Apply selections or filter data based on 2 dates
i have to create 2 filter with date i.e. filter 1 start date filter 2 and end date, and when user select or write in 1st filter search >=20-02-2021 and in 2nd filter <= 09-05-2022 so its should show all data between this date.
i want 2 date filter and if user write in 1st filter 22-02-2021 in addition he wright 06-02-2022 in 2nd filter so my all dashboard should show all data between this date.
- Subscribe by Topic:
-
Chart
-
Developers
-
dimension
-
expression
-
filter
-
General Question
-
Set Analysis
-
Variables
-
Visualization
Accepted Solutions
- Mark as New
- Bookmark
- Subscribe
- Mute
- Subscribe to RSS Feed
- Permalink
- Report Inappropriate Content
Hello,
Here are 2 examples that helped me achieve the specified use case scenario:
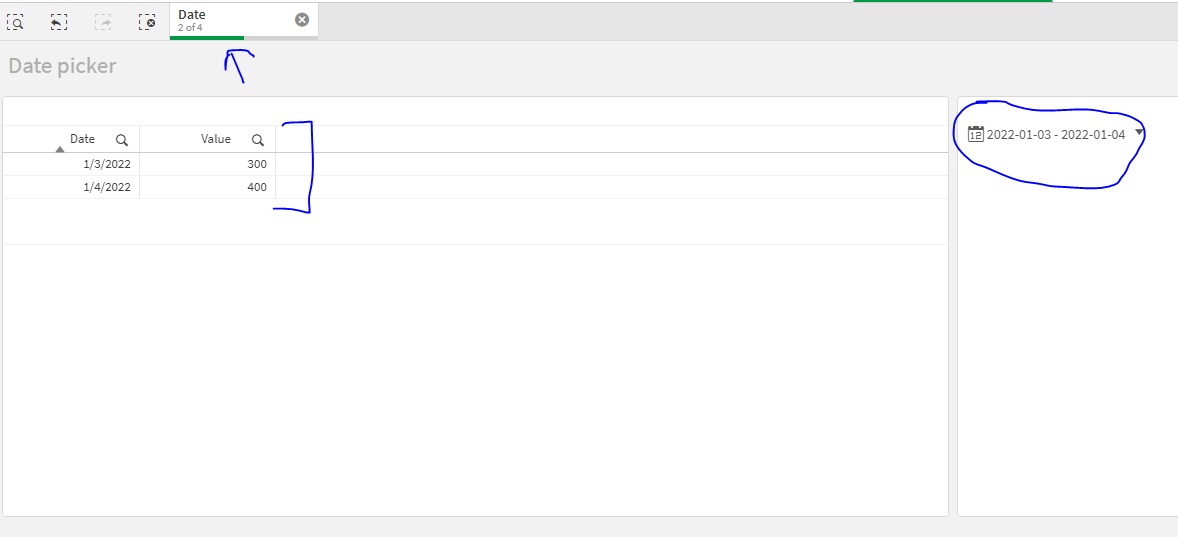
Option 1: Date picker
You can use a Date picker object that will allow you to select start date and end date, which will help you select all the date values for the specified range.
1. Create a Straight table chart and a Date picker
2. Apply some selections on Date picker and those selections will be applied to all the charts with the same state
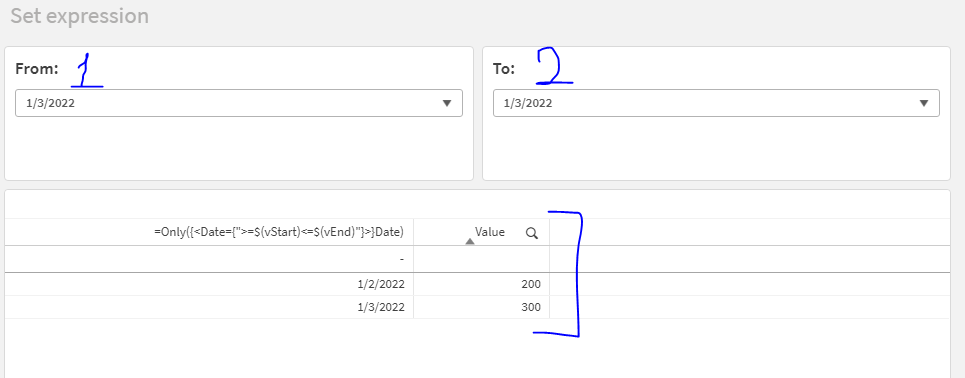
Option 2: Set analysis and Variable input object
1. Create 2 variables:

2. Create a Straight table and use the measure: =Only({<Date={">=$(vStart)<=$(vEnd)"}>}Date)
This measure will a display only the values where Date is between the specified range in the variables
3. Create 2 Variable inputs for vStart and vEnd variables
4. Specify the data accordingly:
- Appearance > Variable > Name: vStart | vEnd
- Appearance > Variable > Show as: Drop down
- Appearance > Values > Fixed or dynamic values: Dynamic
- Appearance > Values > Dynamic values: =Concat(Date, '|')
5. Selecting start and end date, will give you the outcome:
NOTE: The first option will apply the selections as you need them, but for the second option you will have to use the same technique in every chart that you want to be affected.
I hope that this information was helpful. In case I have misunderstood the use case scenario, please elaborate in details by providing additional information. However, if it has helped you resolve the issue, addressed your concerns or at least pointed you in the right direction, please mark it as Accepted Solution to give further visibility to other community members.
- Mark as New
- Bookmark
- Subscribe
- Mute
- Subscribe to RSS Feed
- Permalink
- Report Inappropriate Content
Hello,
Here are 2 examples that helped me achieve the specified use case scenario:
Option 1: Date picker
You can use a Date picker object that will allow you to select start date and end date, which will help you select all the date values for the specified range.
1. Create a Straight table chart and a Date picker
2. Apply some selections on Date picker and those selections will be applied to all the charts with the same state
Option 2: Set analysis and Variable input object
1. Create 2 variables:
2. Create a Straight table and use the measure: =Only({<Date={">=$(vStart)<=$(vEnd)"}>}Date)
This measure will a display only the values where Date is between the specified range in the variables
3. Create 2 Variable inputs for vStart and vEnd variables
4. Specify the data accordingly:
- Appearance > Variable > Name: vStart | vEnd
- Appearance > Variable > Show as: Drop down
- Appearance > Values > Fixed or dynamic values: Dynamic
- Appearance > Values > Dynamic values: =Concat(Date, '|')
5. Selecting start and end date, will give you the outcome:
NOTE: The first option will apply the selections as you need them, but for the second option you will have to use the same technique in every chart that you want to be affected.
I hope that this information was helpful. In case I have misunderstood the use case scenario, please elaborate in details by providing additional information. However, if it has helped you resolve the issue, addressed your concerns or at least pointed you in the right direction, please mark it as Accepted Solution to give further visibility to other community members.
- Mark as New
- Bookmark
- Subscribe
- Mute
- Subscribe to RSS Feed
- Permalink
- Report Inappropriate Content
Thank yoou so much bro
- Mark as New
- Bookmark
- Subscribe
- Mute
- Subscribe to RSS Feed
- Permalink
- Report Inappropriate Content
Hi
its working but when i put any other measure field so its showing result like this .png")
and second thing in variable drop down i want date in ascending order but its showing like this
.png")
- Mark as New
- Bookmark
- Subscribe
- Mute
- Subscribe to RSS Feed
- Permalink
- Report Inappropriate Content
Hello,
You can apply the same logic on the measure as well. For example:
1. I have added a measure: =Count(Value)

2. Then I have changed the measure to: =Count({<Date={">=$(vStart)<=$(vEnd)"}>}Value)
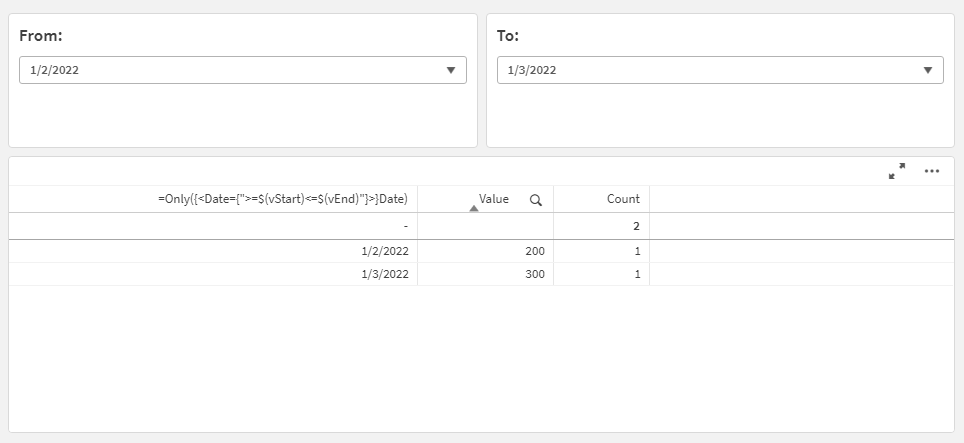
As you can see, the Straight table has limited the amount of data again.
I hope that this information is helpful. In case it has helped you resolve the second issue as well, please mark it as Accepted Solution as well, to ensure that it gives further visibility for other community members.