Unlock a world of possibilities! Login now and discover the exclusive benefits awaiting you.
- Qlik Community
- :
- All Forums
- :
- QlikView
- :
- Combining values from multiple dimensions in one a...
- Subscribe to RSS Feed
- Mark Topic as New
- Mark Topic as Read
- Float this Topic for Current User
- Bookmark
- Subscribe
- Mute
- Printer Friendly Page
- Mark as New
- Bookmark
- Subscribe
- Mute
- Subscribe to RSS Feed
- Permalink
- Report Inappropriate Content
Combining values from multiple dimensions in one axis
Hi everyone,
I am trying to combine the values from multiple dimensions into one single axis in a bar chart. I think it's easier to explain with an example.
Let's say I have a data model with the sales of a company, and among others, I have geographical dimensions (let's say province) and product dimensions (let's say article). I can create two different bar charts, showing the total sales split among the different provinces and another one showing the sales split among articles. But is there any way I can mix the values of the two dimensions in the same graph? I also need to sort all the values by expression, regardless of whether it is a province or an article. So, for instance, what I want, in a table chart, should look like:
Dimension - Sum(Sales)
Province A - 10000
Province X - 9500
Article B - 8900
Province M - 8500
Article Z - 8000
Article D - 7000
Province B - 6500
Thank you for your help.
- « Previous Replies
- Next Replies »
Accepted Solutions
- Mark as New
- Bookmark
- Subscribe
- Mute
- Subscribe to RSS Feed
- Permalink
- Report Inappropriate Content
Attached is one way to do it without touching the data model since you don't want to do that. I used $Field as a hidden dimension in the chart, then picked the right field based on the value of $Field. I believe it could be easily extended to as many dimensions as you want to use.
Edit: There's no reason for the hidden dimension of $Field. That does nothing for us.
Dimension 1: $Field
Dimension 2: =pick(match($Field,'Article','Province'),[Article],[Province])
Expression: sum(Sales)
- Mark as New
- Bookmark
- Subscribe
- Mute
- Subscribe to RSS Feed
- Permalink
- Report Inappropriate Content
May be use a calculated dimension or combine the two in the script:
LOAD Province & ' ' & Product as TableDim
or a calculated dimension
Province & ' ' & Product
- Mark as New
- Bookmark
- Subscribe
- Mute
- Subscribe to RSS Feed
- Permalink
- Report Inappropriate Content
Hi,
Unfortunately this doesn't work. This system establishes a relationship between the two dimensions, and what I want is the values to be completely independent. What you suggest here would return something like this:
Dimension - Sum(Sales)
Province A Article A- 1000
Province X Article B- 950
Province Z Article B - 890
Province M Article M - 800
Province M Article Z - 800
Province A Article D - 700
Province B Article Z- 650
Not exactly what I need, which is:
Dimension - Sum(Sales)
Province A - 10000
Province X - 9500
Article B - 8900
Province M - 8500
Article Z - 8000
Article D - 7000
Province B - 6500
- Mark as New
- Bookmark
- Subscribe
- Mute
- Subscribe to RSS Feed
- Permalink
- Report Inappropriate Content
Hi,
Create one more additional dimension in your script by using
Data:
LOAD
*,
Province & ' ' & Product as NewDimension
FROM DataSource;
Now use NewDimension field in the chart.
Hope this helps you.
Regards,
Jagan.
- Mark as New
- Bookmark
- Subscribe
- Mute
- Subscribe to RSS Feed
- Permalink
- Report Inappropriate Content
Hi,
Thank you for your reply but this throws the same results as the previous answer. Not exactly what I'm looking for, as I explained in the previous message.
Cheers,
Ignasi.
- Mark as New
- Bookmark
- Subscribe
- Mute
- Subscribe to RSS Feed
- Permalink
- Report Inappropriate Content
Would you be able to share some raw data behind the output you are expecting to see. I am not sure how the data is structured and that is why wasn't sure what you wanted.
- Mark as New
- Bookmark
- Subscribe
- Mute
- Subscribe to RSS Feed
- Permalink
- Report Inappropriate Content
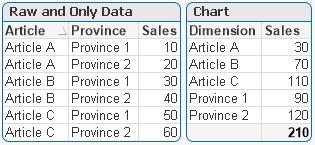
The data is complex but for the sake of simplicity please assume we have the following input:
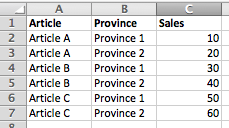
My desired output table would look like:
Dimension ... Sum(Sales)
Province 2 ... 120
Article C ... 110
Province 1 ... 90
Article B ... 70
Article A ... 30
I hope this example helps understand what I'm trying to achieve. The real scenario is more complex, with more than two dimensions and several tables involved, but if someone can help me work out this simple example, I guess I can apply the same method to a bigger scenario.
- Mark as New
- Bookmark
- Subscribe
- Mute
- Subscribe to RSS Feed
- Permalink
- Report Inappropriate Content
Hi,
You have to try like this using Concatenate
Data:
LOAD
Article AS Dimension,
Sales
FROM DataSource;
Concatenate(Data)
LOAD
Province AS Dimension,
Sales
FROM DataSource;
Now use Dimension field as dimension in your chart.
Hope this helps you.
Regards,
Jagan.
- Mark as New
- Bookmark
- Subscribe
- Mute
- Subscribe to RSS Feed
- Permalink
- Report Inappropriate Content
The problem is that the real scenario has a lot more dimensions, and I was trying to avoid using only one field in the script - that would be really bad for other purposes of the model. So my question is if there is any way I can do this without merging all the dimensions into one in the script load.
- Mark as New
- Bookmark
- Subscribe
- Mute
- Subscribe to RSS Feed
- Permalink
- Report Inappropriate Content
I think it is not possible without merging into a single field.
Regards,
Jagan.
- « Previous Replies
- Next Replies »