Unlock a world of possibilities! Login now and discover the exclusive benefits awaiting you.
- Qlik Community
- :
- All Forums
- :
- QlikView
- :
- Show two dimensions on x-axis of a chart
- Subscribe to RSS Feed
- Mark Topic as New
- Mark Topic as Read
- Float this Topic for Current User
- Bookmark
- Subscribe
- Mute
- Printer Friendly Page
- Mark as New
- Bookmark
- Subscribe
- Mute
- Subscribe to RSS Feed
- Permalink
- Report Inappropriate Content
Show two dimensions on x-axis of a chart
Hi,
Is ther any way to show two dimension(For eg, Year and Quarter) both on x-axis of a bar chart?
- « Previous Replies
-
- 1
- 2
- Next Replies »
- Mark as New
- Bookmark
- Subscribe
- Mute
- Subscribe to RSS Feed
- Permalink
- Report Inappropriate Content
Hi Kakarottoo
In a normal bar chart, if you have 2 dimensions qlikview will compare them side by side, either stacked or grouped in different colours.
If you add a third dimension, however, qlikview will show the first two on the x axis. In the image below I ahve added a third "dummy" dimension where the calculation is "=1" and this forces the year and month onthe the x axis
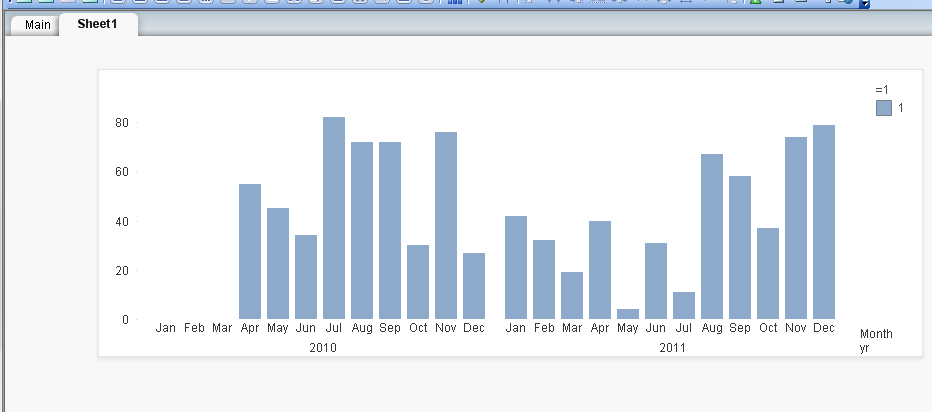
Is this what you need?
Regards,
Erica
- Mark as New
- Bookmark
- Subscribe
- Mute
- Subscribe to RSS Feed
- Permalink
- Report Inappropriate Content
is it possible to get different colors on the bars that are grouped? hence, one color for january another one for february etc.?
- Mark as New
- Bookmark
- Subscribe
- Mute
- Subscribe to RSS Feed
- Permalink
- Report Inappropriate Content
Hi Borgannika
2 ways to do this:
If you remove the dummy dimension, month will no longer be displayed on the X - axis but will return to the legend, meaning each month is a different colour. However there are issues if you have missing data, (will need to display all values, ie not suppressed for 0's)
The alternative is to use the expression list to define a colour depending on the month. In the expression tab, expand the expression that has the bars that you are interested in. under "background colour" enter a formula not dissimilar to:
pick([Month Number],Red(), blue(), lightred().....)
This will take the number of the nth month and match it to the nth colour in the list. EG above, february would be blue
kakarotoo: an alternative is to use "text on Axis" checked as an expression then use that expression to display the month. I completely forgot about this functionality!
Thanks
Erica Whalley
- Mark as New
- Bookmark
- Subscribe
- Mute
- Subscribe to RSS Feed
- Permalink
- Report Inappropriate Content
Hi Erica,
How to hide the values 2010 and 2011 in the chart?
I need to hide the second dimension at the x-axis.
how we can do that?
- Mark as New
- Bookmark
- Subscribe
- Mute
- Subscribe to RSS Feed
- Permalink
- Report Inappropriate Content
Hi Erica,
Could you please let me know how to add dummy variable ?
Thanks,
Dhawal
- Mark as New
- Bookmark
- Subscribe
- Mute
- Subscribe to RSS Feed
- Permalink
- Report Inappropriate Content
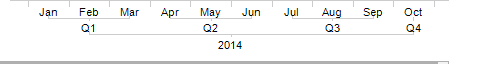
what if I want to show 3 variables on X-axis , as shown below -

- Mark as New
- Bookmark
- Subscribe
- Mute
- Subscribe to RSS Feed
- Permalink
- Report Inappropriate Content
Hi Dhawal,
If still relevant...
In the dimension tab there is a button next to the Edit button 'Add Calculated Dimension'. Click on that and enter =1.
It will add the 'dummy' dimension which is a calculated dimension.
Cheers,
Hila.
- Mark as New
- Bookmark
- Subscribe
- Mute
- Subscribe to RSS Feed
- Permalink
- Report Inappropriate Content
Hi Hila,
Thanks for your reply. I solved that but now I am having problem to show 3 dimensions on X-axis. Please let me know if you know this.
how to show 3 dimensions on x-axis ? As shown b... | Qlik Community
- Mark as New
- Bookmark
- Subscribe
- Mute
- Subscribe to RSS Feed
- Permalink
- Report Inappropriate Content
hey erica,
i have two fields that i want to show in two charts like yours. is it possible?
thanks a lot!
best
- « Previous Replies
-
- 1
- 2
- Next Replies »