Unlock a world of possibilities! Login now and discover the exclusive benefits awaiting you.
- Qlik Community
- :
- Forums
- :
- Analytics & AI
- :
- Products & Topics
- :
- Connectivity & Data Prep
- :
- Re: Network Analysis in Qlik Sense
- Subscribe to RSS Feed
- Mark Topic as New
- Mark Topic as Read
- Float this Topic for Current User
- Bookmark
- Subscribe
- Mute
- Printer Friendly Page
- Mark as New
- Bookmark
- Subscribe
- Mute
- Subscribe to RSS Feed
- Permalink
- Report Inappropriate Content
Network Analysis in Qlik Sense
I have a group of 100 people that are connected through certain properties.
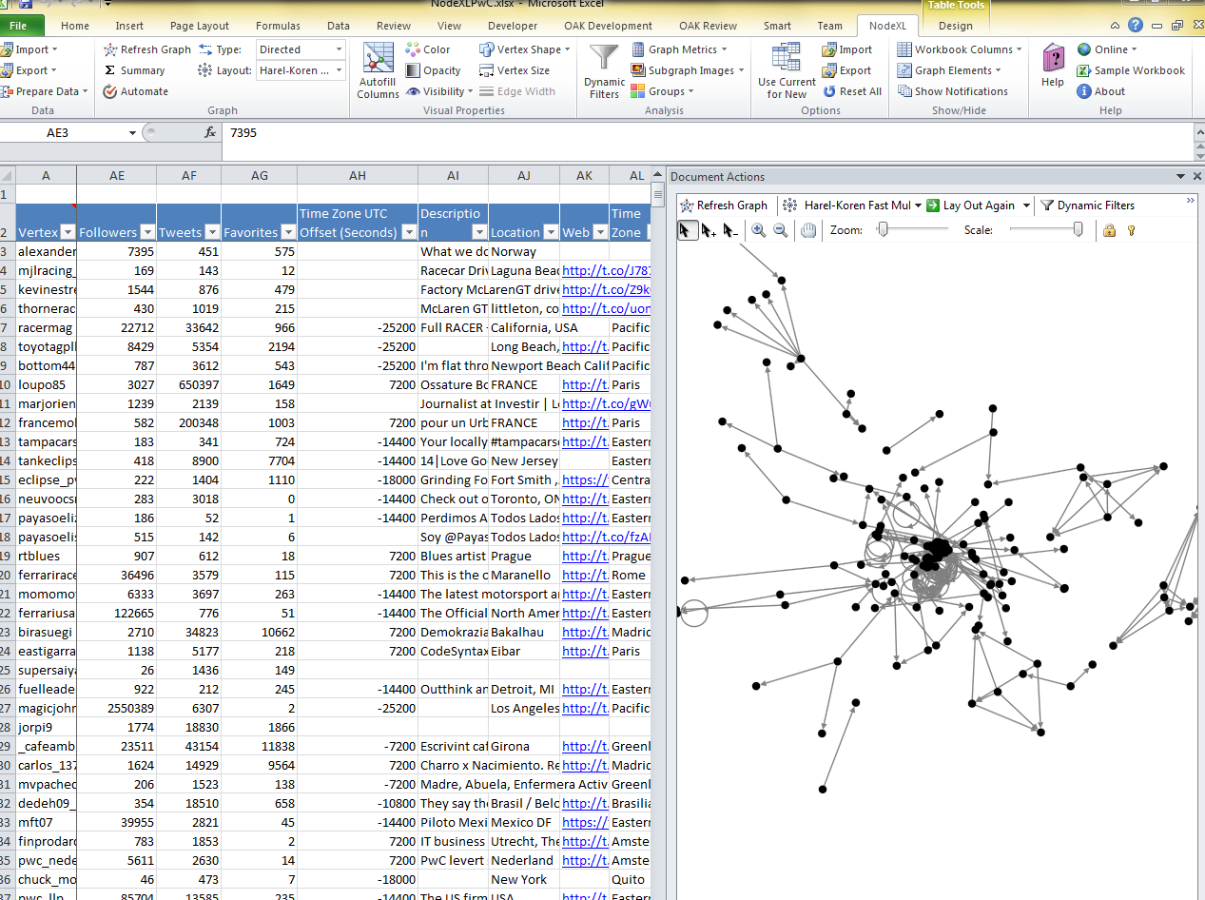
Is there a way how to visualize teams within a network such as in the picture below?
Thank you very much for your help!

Accepted Solutions
- Mark as New
- Bookmark
- Subscribe
- Mute
- Subscribe to RSS Feed
- Permalink
- Report Inappropriate Content
You can search for an appropriate Sense extension, maybe like
GitHub - miclae76/network-vis-chart: network visualisation extension for Qlik Sense based on vis.js
- Mark as New
- Bookmark
- Subscribe
- Mute
- Subscribe to RSS Feed
- Permalink
- Report Inappropriate Content
You can search for an appropriate Sense extension, maybe like
GitHub - miclae76/network-vis-chart: network visualisation extension for Qlik Sense based on vis.js
- Mark as New
- Bookmark
- Subscribe
- Mute
- Subscribe to RSS Feed
- Permalink
- Report Inappropriate Content
I just used the extension and now try to fill in my date - thank you.
Is there a way that the weight of the relationship is calculated by a certain formula or do I have to create a table where all relations are displayed? Let's say people are in a team if they are working on projects together. Do I have to set up a document where it says Person 1, Person 2 = 1 and Person 2, Person 3 = 1 or can Qlik combine this information on its own because the people are linked to the same project ID?
- Mark as New
- Bookmark
- Subscribe
- Mute
- Subscribe to RSS Feed
- Permalink
- Report Inappropriate Content
You can tweak the extension & modify as per your needs.