Unlock a world of possibilities! Login now and discover the exclusive benefits awaiting you.
- Qlik Community
- :
- Blogs
- :
- Technical
- :
- Design
- :
- 4 tips to start working with QlikView - Developer ...
- Subscribe to RSS Feed
- Mark as New
- Mark as Read
- Bookmark
- Subscribe
- Printer Friendly Page
- Report Inappropriate Content
My first blog post was about 4 tips to start working with QlikView, the title was right but it was incomplete in a way. I was referring to 4 tips for designers. Koen left a comment pointing that it would be nice to have a version for developers. I agreed, so I contacted Luis Cortizo one of our best consultants, to have a conversation about the most frequently asked questions that came up during the first days of QlikView training. Here are some tips:
1. Forget everything you knew about data modeling.
Ok, you don't need to forget everything, but you better be open minded to learn a new way to see and work with your data. There are some SQL modeling rules, constraints and hierarchies that you won't need anymore, QlikView is a lot easier than that. And yes, you will need to learn how to work with the script but trust me, this is about common sense rather than strong data base skills.
If you are looking at the best way to create your data model, best practices will guide you to Star or Snowflake models. But remember, always start by understanding the business needs, then you will know what tables makes sense to have in your app and how you can join them. By doing that your data model will often look like a star or snowflake.
2. Practice with your personal data.
QlikView is probably one of the most comprehensive tools in the data visualization market. It could be used for creating corporate apps with billions of rows of data and thousands of users or it could be used to visualize your personal music library or your file system.
When starting to create an app, frequently the hardest task will be to understand the business needs, particularly if you are in a complex corporate environment or if you are dealing with incomplete requirements.
If you are a QlikView novice, my advice is to practice by loading some personal data and by trying to create something with meaning for you, that way you could practice with data modeling and visualization and you will learn how both are related.
For example, I just moved to the US from Spain so lastly I use Skype to talk with family. Understand that talking on the telephone is not one of my favorite things to do so, if during the day I have to make several calls, I try to keep the call duration as short as possible. Intuitively I think I should see an inverse correlation in my call history, in other words, the more calls per day the shorter average duration will be.
To prove my intuition, I just downloaded several CSV files from the Skype website which contained call activity historical data for the last 8 months. Once the data was loaded into the QlikView app, I used a scatter chart to see if I could prove my theory.
Because real data is (sometimes) ugly I had to transform the call duration from HH:MM:SS to seconds to normalize it and typically I want to work with dates in a human readable format rather than computer timestamps.
 The fact that I had my goal well defined - to show if there´s a correlation or not - helped me to identify what I had to have as an output from my model. In this example I needed to count the number of calls per day and this business requirement forced me to create a new field named "Calls". Later on using an expression like sum(Calls) I could obtain the number of calls per day (or any other dimension).
Finally and after a few transformations I was able to produce the chart I was looking for:
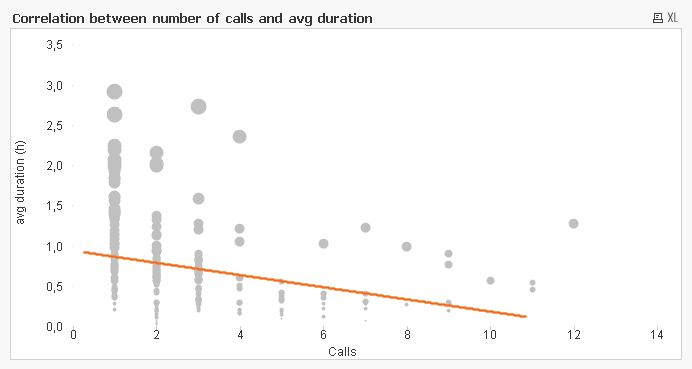
Looking at the chart, I can see that there is a non-strong (how close the points are to a straight line) inverse correlation between X and Y axis. Note: remember that correlation does not imply causation.
Unfortunately, the data did not support my hypothesis. I did, however, learn how to show correlation and next time I will need to show how two variables are related I will always remember what I did with my personal data.
3. Start simple.
The QlikView approach to app development is based on quick iterations, small steps that put all together will let you build amazing apps. To start working in a new data model, you better start by loading a couple of tables and then create some list boxes with the fields you has just loaded. This will help you to experiment with QlikView Associative experience.
Green, Gray and White color code will provide you with a great feedback. If everything is working fine, then is time to start with the second phase of your development including a new table or data source, remember that a QlikView app can contain data coming from multiple sources, inside and outside your organization.
The more time you invest in a good data model the less you will spend on design, that´s the golden rule. And again having well-defined business goals will help you to collect, normalize or denormalize data to specifically respond to that business needs. This for sure will simplify the development process.
4. Search, copy, reuse… and share.
QlikView functions set is one of the most powerful data transformation sets in the market, it's important to get familiarized with it, every time you get stacked on how to achieve a complex calculation, use the search function in QlikView Help (F1).
It’s also crucial to get involved in the QlikView Community - one of the most vibrant websites to discuss about data modelling and visualization - by searching, reading, asking and answering questions, but also by sharing… what makes unique our Community is the ability to share apps and get feedback from other business users.
Enjoy Qliking!
AMZ
You must be a registered user to add a comment. If you've already registered, sign in. Otherwise, register and sign in.