Unlock a world of possibilities! Login now and discover the exclusive benefits awaiting you.
- Qlik Community
- :
- Blogs
- :
- Technical
- :
- Design
- :
- Colors in charts
- Subscribe to RSS Feed
- Mark as New
- Mark as Read
- Bookmark
- Subscribe
- Printer Friendly Page
- Report Inappropriate Content
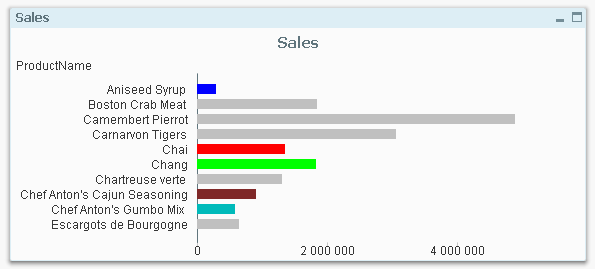
It is not uncommon that users want specific products or customers to be displayed in specific colors. The most obvious way to do this is to change the colors in the chart properties. This is in fact quite easy if you use the copy and paste functions found when you right-click a color button. Just copy one button and paste on another, and you have moved the color.
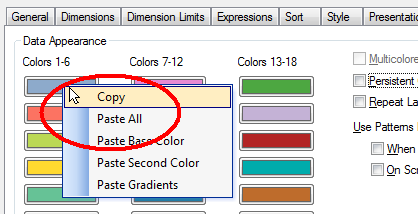
This way you can assign which color is to be used for the different values of the field. However, a prerequisite for this to work is that the order of the field values doesn’t change.
A more robust way is to use color functions. Usually, you want to set the color of a bar, line or bubble and this is done by using the “Background Color” on the Expression tab:
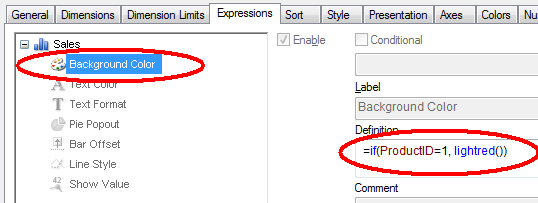
By the way – don’t use Visual cues. This feature is old and not very versatile. Use color functions as described here instead.
In the picture above, both the product ID and the color are hard-coded in the expression. However, if you want to define colors for many products, the if-function will not be manageable. Then it is better to store this information in a table – either in the database or in an Excel sheet or as an inline statement in a scriptlet that is included in the script. Hence,
- Create your color definition table and store it in an appropriate place. The Red, Green and Blue columns hold the different color components and define the color uniquely.
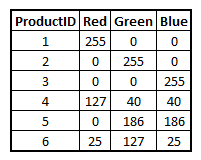
- Load the color definitions into a mapping table:
ProductColors:
Mapping Load ProductID, Rgb(Red,Green,Blue) as ProductColor From ProductColors - Use this mapping table when loading the products table, creating a new field for the product color:
Applymap('ProductColors', ProductID , LightGray()) as ProductColor
The third parameter, here lightgray(), defines which color the unlisted products should get. If you instead use null(), the unlisted products will be multicolored according to the color settings in the chart properties. - Finally, use this field as product color in the charts:
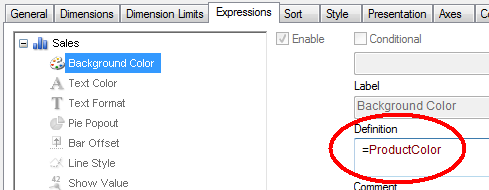
This way it is easy to define which color specific products, customers, or other dimensions should get.
Which colors to use? Oh, that is a completely different topic:
- Stephen Few has a number of good general recommendations.
- Adam Bellerby has some recommendations on how to avoid problems for color blind users.
- Shima Auzins suggests using colors as warning signals.
- « Previous
-
- 1
- 2
- 3
- 4
- Next »
You must be a registered user to add a comment. If you've already registered, sign in. Otherwise, register and sign in.