Unlock a world of possibilities! Login now and discover the exclusive benefits awaiting you.
- Qlik Community
- :
- Blogs
- :
- Technical
- :
- Design
- :
- Google Annotation Chart - Qlik Sense Extension and...
- Subscribe to RSS Feed
- Mark as New
- Mark as Read
- Bookmark
- Subscribe
- Printer Friendly Page
- Report Inappropriate Content
In a project that I am currently working on, we thought that it would be a great idea, if we displayed data much like Google Finance, with line chart and annotations. Of course this does not currently exist in Qlik Sense so I decided first to create it in my Angular Template (Qlik Branch). Once that was done, I moved it into a directive for easier distribution and then created an extension for it, so we can use it in other projects straight from Sense without the need of my template.
For the Directive, we need to define the options in our controller like:
$scope.googleAnnotation = {
  id: 'cases',
  title: 'New Cases by Department over time',
  height: 600,
  dimensions: [
    'Case Created Date',
    'Case Owner Group', // Title
    'Case Owner', // Description
  ],
  measures: [
    "=Sum([Number of New Cases])",
  ],
  headers: ['Date', 'Number of New Cases','Case Owner Group','Case Owner'],
  options: {
    displayAnnotations: true,
    colors: ['#cc3c3c','#395878','#c88d8d','#6f92b5'],
    displayAnnotationsFilter: true,
    displayDateBarSeparator: true,
    displayZoomButtons: true,
    displayRangeSelector: true,
    thickness: 2,
  },
  }
  $scope.dt = {
    from: new Date(2015, 0, 1),
    to: new Date(2015, 3, 1)
  };
And in our html view
<google-annotation-chart data-data="googleAnnotation" data-dt="dt"></google-annotation-chart>
For this example I am connected to helpdesk that is bundled in Qlik Sense Desktop.
We have to get the data in this specific order, Date, Annotation Title, Annotation Description, X-Axis data for the first line as a measure
dimensions: [
    'Case Created Date',
    'Case Owner Group', // Title
    'Case Owner', // Description
  ],
  measures: [
    "=Sum([Number of New Cases])",
  ],
There are some headers that appear on top of the line chart as we move our mouse. We define those in the headers array
headers: ['Date', 'Number of New Cases','Case Owner Group','Case Owner'],
The options are described here and you can pass any of those if you want:
Annotation Chart | Charts | Google Developers
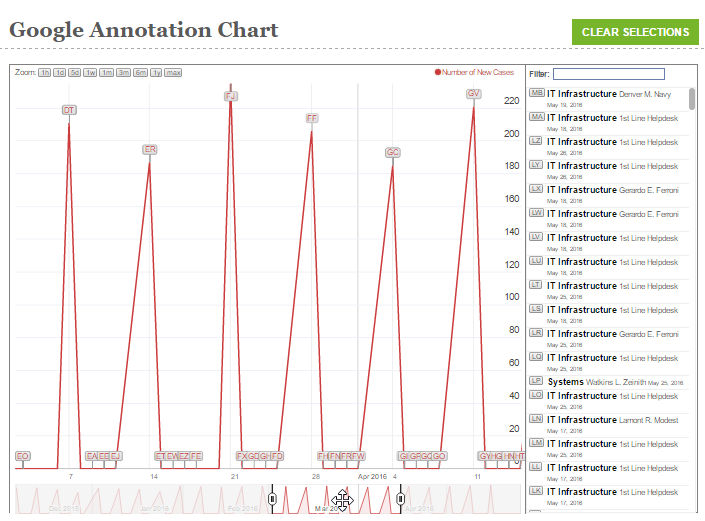
The final results should look like
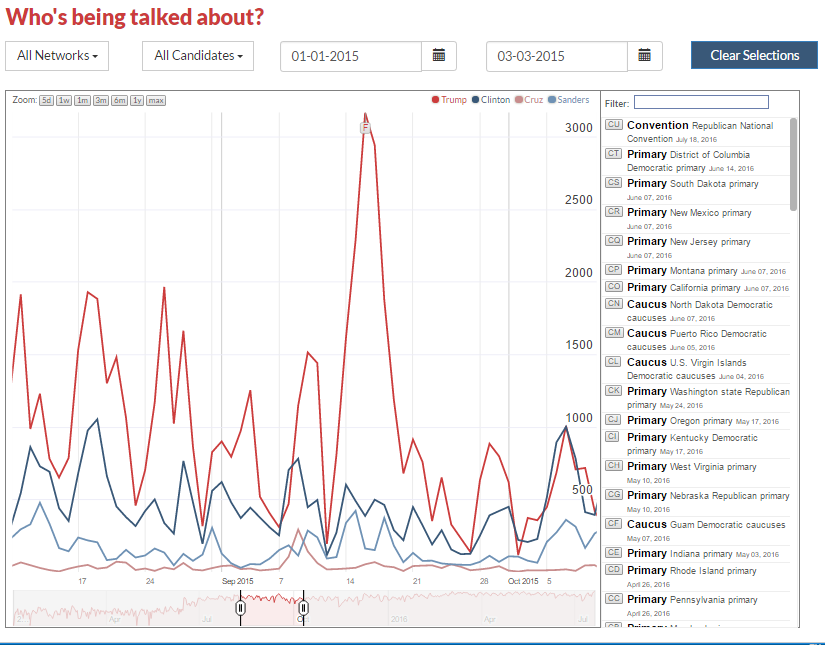
Here is another version for the Presidential Election where we pass selections and zooming, found at
For the Extension, you can get it from
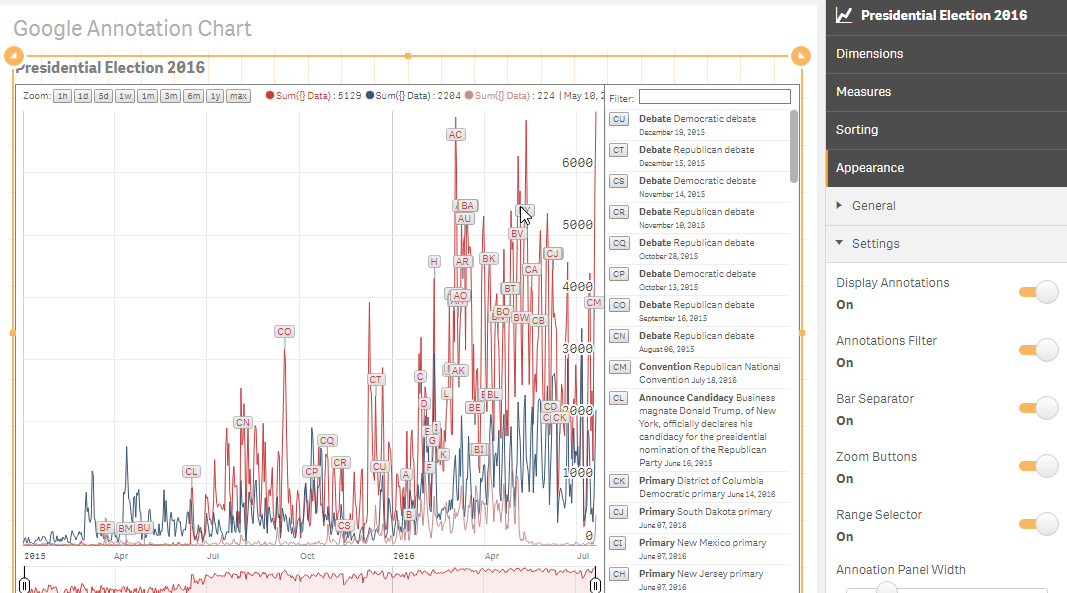
The various settings that I have so far:
- Display Annotations
- Annotations Filter
- Bar Separator
- Zoom Buttons
- Range Selector
- Annoation Panel Width
- Line Headers (In single quotes separated by comma)
- Line Colors (HEX value separated by comma)
- Line Thickness
For installation instructions and usage, please follow the guidelines at the project's homepage.
Angular Template:
Directive Example :
http://webapps.qlik.com/yianni/playground/index.html#/google-annotation-chart
Google Referance:
Annotation Chart | Charts | Google Developers
Download Extension from:
GitHub - yianni-ververis/google-annotation-chart: Google Annotation Chart
Yianni
You must be a registered user to add a comment. If you've already registered, sign in. Otherwise, register and sign in.