Unlock a world of possibilities! Login now and discover the exclusive benefits awaiting you.
- Subscribe to RSS Feed
- Mark as New
- Mark as Read
- Bookmark
- Subscribe
- Printer Friendly Page
- Report Inappropriate Content
In order to go beyond the default charts and custom object bundles that ship with Qlik Sense, you need to develop custom visualization extensions which will allow you to extend the capabilities of Qlik Sense using standard web technologies. In this post, we will cover how to leverage Qlik’s open source solution, Nebula.js, a collection of JavaScript libraries and APIs that make this task easy!
Once the visualization is developed using Nebula.js, you can then bring it to Qlik Sense to be used in your Apps.
- Pre-requisites and project creation
First things first, let’s make sure you have all you need to get started.
- Access to a terminal (we will need this to run nebula.js CLI commands)
- Node.js installed in your computer (v10 or higher)
- A text editor (VS code or similar)
- Web Integration ID (you can get this from the Management Console under “Web” on your Qlik Cloud Tenant. Make sure to put http://localhost:8000 in the Allowed Origins)
Once you have the pre-requisites covered. Fire up your terminal and write the following command.
npx @nebula.js/cli create streamchart --picasso minimal
This command uses Nebula.js CLI, a handy command line program that let’s us bootstrap our project easily.
Notice that we added the –picasso flag after the project name with option minimal. This will add the necessary files to our project for Picasso.js, Qlik’s open source charting library that we will use to build the chart.
Speaking of the chart, we are going to build a Stream Chart in this post to visualize Yearly sales by month.
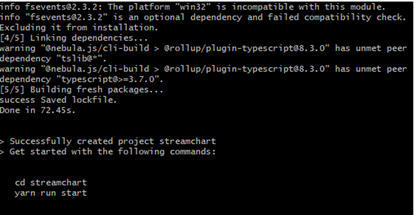
Once the cli command is finished running and the project is successfully created, change your directory into it using “cd streamchart” and then run it using “yarn run start”. Then open the folder in your text editor.
Below is the folder structure of the project. All the work is done under src.
Notice that the package.json file has the scripts we will be using to develop and build the project as well a script to generate the Qlik Sense ready files for the extension. It also lists all the libraries needed in our project, including Picasso.js, Nebula.js/stardust.
/src
- index.js - Main entry point of the visualization
- object-properties.js - Object properties stored in the app
- pic-definition.js – Picasso components definition
- data.js - Data configuration
- The Development Server
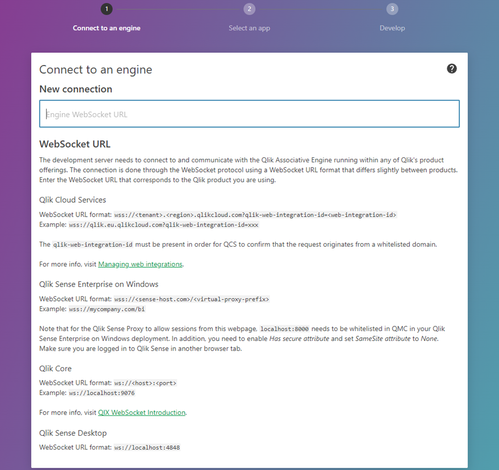
After running the “yarn run start” command, the project will open in your browser at localhost:8000. This is the Local Development Server that we will use to test the visualization extension as we develop it.First step is to connect to the Qlik Engine. To do this, you need to plug in the Websocket URL in the following format:
wss://yourtenant.us.qlikcloud.com?qlik-web-integration-id=yourwebintegrationidAfter we enter the WebSocket URL, we’re prompted to pick our Qlik Sense App that contains our data. Once the app picked, we move to the main edit screen of the local development server.
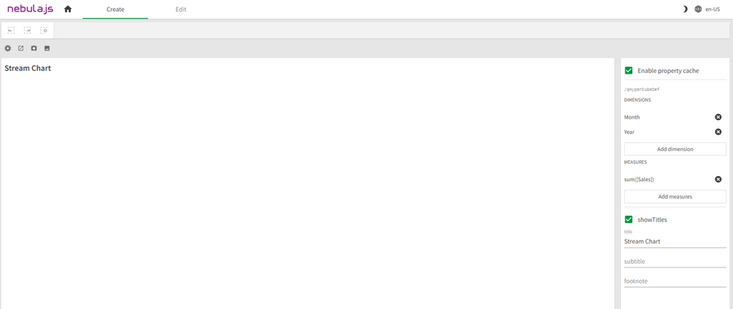
The center section is where our visualization is rendered, and the right sidebar allows us to build up our qHyperCubeDef by selecting Dimensions and Measures.
Remember: edits to the src/index.js that are related to the output, will lead to an auto refresh of the visualization allowing you see live changes in the center section
- Configuring the Data Structure
In previous posts, I have covered details about building HyperCubes and configuring qHyperCubeDef, if you’re new to the concept, don’t hesitate to go through those posts first.
PT 1 and PT2For the purposes of our Stream Chart visualization, we will rely on the automatic generation of the qHyperCubeDef once we choose our Dimensions and Measure on the right side bar.
But if you wanted to make further changes to it, click on the Gear icon on the top-left of the center section to open the qHyperCubeDef object edit popup.
- Adding the Picasso.js components definition
So far, nothing is rendered on the Dev Server UI. So, let’s go ahead and configure the Picasso.js Definition to create the necessary components.
Under pic-definition.js, enter the following code:
export default function ({
  layout, // eslint-disable-line no-unused-vars
  context, // eslint-disable-line no-unused-vars
}) {
  return {
    collections: [{
      key: 'stacked',
      data: {
        extract: {
          field: 'qDimensionInfo/0',
          props: {
            line: { field: 'qDimensionInfo/1' },
            end: { field: 'qMeasureInfo/0' },
          },
        },
        stack: {
          stackKey: (d) => d.value,
          value: (d) => d.end.value,
          offset: 'silhouette',
          order: 'insideout',
        },
      },
    }],
    scales: {
      y: {
        data: {
          collection: {
            key: 'stacked',
          },
        },
        invert: false,
        expand: 0.5,
      },
      t: {
        data: {
          extract: {
            field: 'qDimensionInfo/0',
          },
        },
        padding: 0.5,
      },
      l: {
        data: {
          extract: {
            field: 'qMeasureInfo/0',
          },
        },
      },
      color: {
        data: {
          extract: {
            field: 'qDimensionInfo/1',
          },
        },
        type: 'color',
      },
    },
    components: [
      {
        type: 'axis',
        dock: 'bottom',
        scale: 't',
      },
      {
        type: 'axis',
        dock: 'left',
        scale: 'l',
      },
      {
        key: 'lines',
        type: 'line',
        data: {
          collection: 'stacked',
        },
        settings: {
          coordinates: {
            major: { scale: 't' },
            minor0: { scale: 'y', ref: 'start' },
            minor: { scale: 'y', ref: 'end' },
            layerId: { ref: 'line' },
          },
          layers: {
            curve: 'monotone',
            line: {
              show: false,
            },
            area: {
              fill: { scale: 'color', ref: 'line' },
              opacity: 1,
            },
          },
        },
      },
      {
        type: 'legend-cat',
        scale: 'color',
        key: 'legend',
        dock: 'top',
        settings: {
          title: {
            show: false,
          },
          layout: {
            size: 2,
          },
        },
      },
    ],
  };
}
Notice that the object contains:
- Collections: to stack our data
- Scales
- Components:
- Bottom axis
- Left axis
- Lines component
- Legend
For more information about how to build charts with Picasso.js, visit https://qlik.dev/libraries-and-tools/picassojs and check out some of the previous blog posts.
Go back to the Dev Server UI on the browser, and you should see the chart displayed.
- Package the Visualization Extension, and upload to Qlik Sense
So far, we’ve been working on our local dev environment. We need to generate the necessary files to build the project.
In your terminal run: “yarn run build”. This will generate a “dist” folder containing our extension’s bundled files. You can use this to distribute the extension as an npm package.
However, in order to use this visualization extension in Qlik Sense, we need additional files. Run “yarn run sense” which will create a new folder called “streamchart-ext”.
Make sure to Zip this file in order to get it ready to be uploaded into your Qlik Cloud tenant.
And there you go; you now have a visualization extension that you can use in your Qlik Sense apps!
The full code is on github: https://github.com/ouadie-limouni/qlik-nebula-stream-chart-viz-extension
You must be a registered user to add a comment. If you've already registered, sign in. Otherwise, register and sign in.


