Unlock a world of possibilities! Login now and discover the exclusive benefits awaiting you.
- Qlik Community
- :
- Blogs
- :
- Technical
- :
- Design
- :
- When should the Aggr() function NOT be used?
- Subscribe to RSS Feed
- Mark as New
- Mark as Read
- Bookmark
- Subscribe
- Printer Friendly Page
- Report Inappropriate Content
Last week Adam wrote a post about the Aggr() function and a Technical Brief about how to use it (Explaining the Aggr function). If you haven’t read it, I strongly recommend that you do. It is an excellent paper describing a function that can be used for nested aggregations - complex calculations where you need to make a second aggregation based on the result of a first aggregation.
However, I have noticed in the discussion forum that Aggr() often is used when it isn’t necessary. And since you get a performance penalty when you use the function, today’s post is about discouraging you from using it when you don't need to.
So, when should you not use it?
1. Standard Aggregations
Standard, non-nested aggregations, e.g. “=Sum(Sales)” or “=Count(distinct OrderID)” can be used almost anywhere in QlikView, in charts, in text boxes and as labels in any object. They will work directly as they are. Here you do not need any Aggr() function.
If you want to calculate the aggregation several times, e.g. once per customer, just use the aggregation function in a chart and use Customer as dimension. Nothing else.
This seems obvious, but I have on multiple occasions seen developers use the Aggr() function in such situations. Totally unnecessary - and it will just increase response times.
Bottom line: You should not use Aggr() for standard non-nested aggregations.
2. Calculation of a subtotal within the same chart
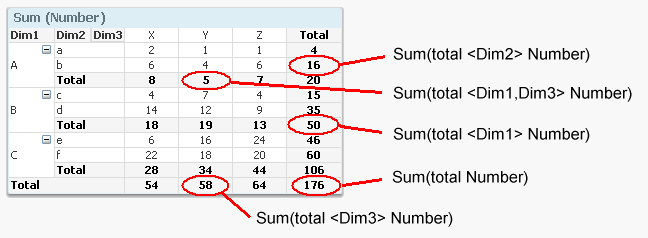
In some cases you need to use a subtotal from the same chart in your calculation. Then you should use the total qualifier inside your Sum() function (or other aggregation function). It will perform the given calculation disregarding one or several dimensions of the chart. It will however respect the selection.
For instance, the sales in percent can be calculated using
Sum( Sales ) / Sum( total Sales )
This expression will return the sum of sales for each possible dimensional value, as a fraction of all possible sales. In other words; "Sum( total Sales )" disregards all dimensions of the chart.
Bottom line: You should not use Aggr() for calculating subtotals that you can calculate with the total qualifier.
3. Calculation of an Average
If you can avoid the Aggr() function by writing your expression smarter, you should. One specific case is a standard average.
For example, say that you want to calculate the average order value. This is a nested aggregation: First you need to sum the sales value per order (an order can have several order lines), and then you need to average over the resulting set of sales values per order. In other words: You can calculate it using:
Avg( Aggr( Sum( Sales ), OrderID ) )
But since it is a linear calculation, you can also calculate the same number just by dividing with the number of orders:
Sum( Sales ) / Count( distinct OrderID )
… which in most cases is evaluated faster. Also, the latter expression is easier to understand for the person responsible for the application maintenance.
Bottom line: You should usually not use Aggr() for calculating an average that is a ratio of two separate aggregations.
4. Static aggregations
Sometimes you want to classify a dimensional value (customers, products, suppliers, etc.) using static aggregations, e.g. “Customers that only placed one order” or “Customers that bought goods at a total value higher than X”. “Static” meaning that you do not want the classification to change as you make a selection.
In such a case, the aggregation should not be made in the UI, but rather when creating the data model and stored as a separate field.
Bottom line: Aggregations for classification of dimensional values should often be made by creating an attribute field in the script using a “Group By”.
- « Previous
-
- 1
- 2
- 3
- Next »
You must be a registered user to add a comment. If you've already registered, sign in. Otherwise, register and sign in.