Unlock a world of possibilities! Login now and discover the exclusive benefits awaiting you.
- Qlik Community
- :
- Support
- :
- Support
- :
- Knowledge
- :
- Member Articles
- :
- Expression Scene Investigation, E1: Moving Average
- Edit Document
- Move Document
- Delete Document
- Subscribe to RSS Feed
- Mark as New
- Mark as Read
- Bookmark
- Subscribe
- Printer Friendly Page
- Report Inappropriate Content
Expression Scene Investigation, E1: Moving Average
- Move Document
- Delete Document and Replies
- Mark as New
- Bookmark
- Subscribe
- Mute
- Subscribe to RSS Feed
- Permalink
- Report Inappropriate Content
Expression Scene Investigation, E1: Moving Average
 |
( based on a true story)
Cast:
SUM(),ABOVE(),RANGESUM()
Case:
Return Average of last 3 months(not including current one)
Preparation:
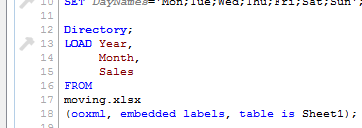
(Click on picture to see full size)
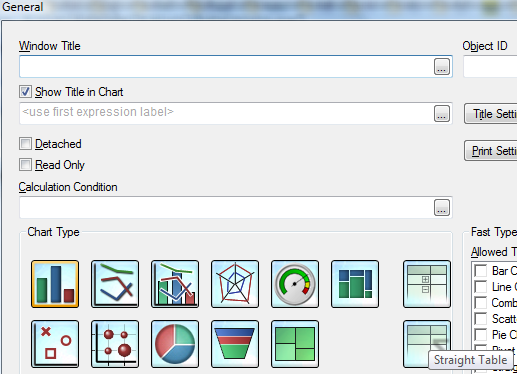
Create Straight Table (Layout-->New Sheet Object-->Chart...) -->

Use:
Year and Month
as dimension -->

and Sales as expression.
(In this example Sales and SUM(Sales) deliver the same results as we have unique values in Month dimension. -->
Investigation:
The expression we are going to take apart is:
Rangeavg(Above(Sum(Sales),1,3))
Step 1) SUM()
The syntax of SUM in Qlikview is quite complicated when used in charts:
(We not going to investigate that now so please refer to Qlikview Help for more details)
For our example we only need:
SUM(Sales)
The result of this expression is:
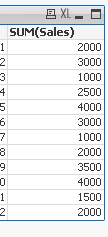
Step 2) ABOVE()

ABOVE takes 3 parameters:
expression - which in our example is: SUM(Sales).(we are ignoring the total here)
offset- this is integer value(0,1,2...) to specify how many rows the whole expression should be move down in relation to current row
n - this is integer value(1,2...) and will return range of values.
Remember: ![]()
The last parameter will only work when used as argument with another Chart Range Function
(please see Qlikview Help for details)
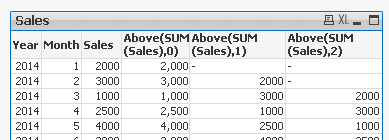
The result of wrapping SUM with ABOVE
ABOVE(SUM(Sales),offset)
is presented below.
Offset of 1,2 and 5 rows:
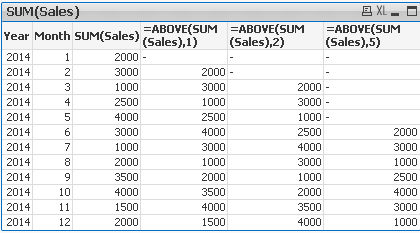
Step 3) Rangeavg()

This function returns average of values or expressions:
Rangeavg(1,1) =1
Rangeavg(1,2,3)=2
RangeAvg(sum(1+2),sum(2+3)) is equal to RangeAvg(3,5)=4
Step 4)
So what actually is going on behind the scene we we use:
Rangeavg(Above(Sum(Sales),1,3))?
We can rephrase that expression to:
" Sum values from dimension Sales then go 1 row above and take values from 3 rows going up"
So based on our example :

Will always return NULL
as we can not got above row 1 -->

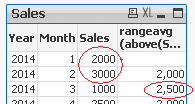
Row two:
We can only go 1 row up and return 1 value
Rangeavg(2000) = 2000
Row three:
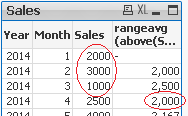
"Go up 1 and return 3 values going up"
We can only go 2 rows up:
Rangeavg (2000,3000) =
(2000+3000)/2=2500
Row four:
"Go up 1 row..."
This is first row where values from 3 rows above
can be returned(Row 1, Row 2 ,Row 3)
Rangeavg(Row 1, Row 2 ,Row 3) = Rangeavg(2000+3000+1000)=6000/3=2000

Row five:
Rangeavg(Row 2, Row 3 ,Row 4)
=Rangeavg(3000+1000+2500)=6500/3=2167
and so on...
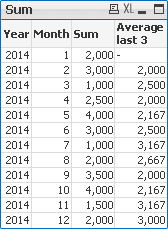
The final result:
Conclusions:
The offset parameter of the ABOVE function according to Qlikview Help:
- Move Comment
- Delete Comment
- Mark as Read
- Mark as New
- Bookmark
- Permalink
- Report Inappropriate Content
Hi Mika
It is great that you take the time to write these missing manuals.
I just want to add that, if you select a month in this solution, you will NOT see the average of the previous three months as you probably would expect.
This could be done using an expression like this:
Sum(
Aggr(
RangeAvg(
Above(
Sum({$< YearMonth,Year,Month>} SalesAmount)
,1,3)
),YearMonth))
It is important though, that your is sorted correctly (required by the AGGR()).
Keep posting these missing manuals.
//Martin
- Move Comment
- Delete Comment
- Mark as Read
- Mark as New
- Bookmark
- Permalink
- Report Inappropriate Content
Thank you Martin,
This is "case"( example) of how to solve particular problem and is not part of missing Manual series but I really appreciate your input and hope that with help other users as well.
- Move Comment
- Delete Comment
- Mark as Read
- Mark as New
- Bookmark
- Permalink
- Report Inappropriate Content
I can see the use of the Above and offset function being quiet useful for bf, cf functions.
Thanks fot sharing.