Unlock a world of possibilities! Login now and discover the exclusive benefits awaiting you.
Recent Documents
-
Important Message Regarding QlikView Documents
For the interim, no new articles can be published. This is because we are consolidating knowledge articles to one location. If you have any question... Show More -
Get User documents for a certain user alone in qlikview API
Hi All, Can anyone help me how can I get User documents for a certain user alone in qlikview API. I have already searched method regarding this in QMS... Show MoreHi All,
Can anyone help me how can I get User documents for a certain user alone in qlikview API. I have already searched method regarding this in QMS Api latest version. But still cannot come up with the solution. Is there any possibility to get user documents alone by passing the user and domain name with server id?
-
Do you Qualify?- How to use QUALIFY statement
What it is used for?The Qualify statement is used for switching on the qualification of field names, i.e. field names will get the table name as a pre... Show MoreWhat it is used for?
The Qualify statement is used for switching on the qualification of field names, i.e. field names will get the table name as a prefix.’

In situation where we have two (or more) Tables with the same field names:
Product Payment 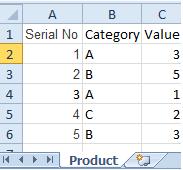
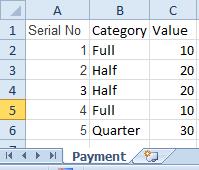
The Qualify statement will assign name of the Table to fields:
- To use the script below the Excel file must be saved in the same folder that your qvd file
Otherwise you will need to make changes the this path - [Qualify.xlsx]
QUALIFY *;
Product:
LOAD [Serial No],
Category,
Value
FROM
Qualify.xlsx
(ooxml, embedded labels, table is Product);
QUALIFY *;
Payment:
LOAD [Serial No],
Category,
Value
FROM
Qualify.xlsx
(ooxml, embedded labels, table is Payment);The Outcome:
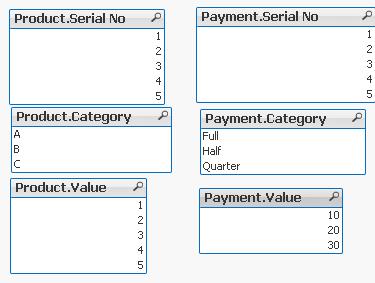
Table Viewer:
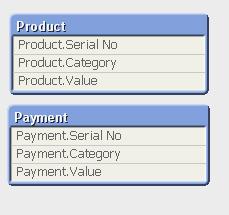
Read only if you need to know more....
If we have not used ‘QUALIFY’ statement in situation as above Qlikview would map both of the Tables with outcome like below:
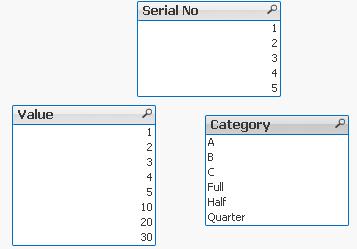
The end result -merge of those two Tables is correct only for the “Serial No” fields
The “Value” and “Category” fields although merged is none of use to us.
To fix this we can only Qualify fields that we do not want to associated:
QUALIFY Category,
Value;
Product:
LOAD [Serial No],
Category,
Value
FROM
Qualify.xlsx
(ooxml, embedded labels, table is Product);
QUALIFY Category,
Value;
Payment:
LOAD [Serial No],
Category,
Value
FROM
Qualify.xlsx
(ooxml, embedded labels, table is Payment);
or by using UNQUALIFY statement:
(which works as opposite to QUALIFY)
QUALIFY *;
UNQUALIFY [Serial No];
Product:
LOAD [Serial No],
Category,
Value
FROM
Qualify.xlsx
(ooxml, embedded labels, table is Product);
QUALIFY *;
UNQUALIFY [Serial No];
Payment:
LOAD [Serial No],
Category,
Value
FROM
Qualify.xlsx
(ooxml, embedded labels, table is Payment);In second example the ‘QUALIFY *’ part will add Table name to all fields and the UNQUALIFY statement will remove those names only from specified fields(this method is very useful if we got large numbers of fields)
Outcome is as below:
Fields:

Table Viewer:

Feeling Qlikngry?
-
How to use- Dual()
Have you ever wonder how the examples from the Qlikview help may look like?Please see below and enjoy responsibly...Dual()Definition:Forced associatio... Show MoreHave you ever wonder how the examples from the Qlikview help may look like?
Please see below and enjoy responsibly...
Dual()
Definition:
Forced association of an arbitrary string representation s with a given number representation x. In QlikView, when several data items read into one field have different string representations but the same valid number representation, they will all share the first string representation encountered. The dual function is typically used early in the script, before other data is read into the field concerned, in order to create that first string representation, which will be shown in list boxes etc.
Syntax:

where
text - this is first column of data
number- this is second column of data

Qlikview has specific way of storing data. Each field is represented by Text and Number data type called dual.
The Text format is visible to user and the Number is being used for calculation and sorting.

You can imagine that each field has top Text layer and bottom
(like salad in your Hamburger) Number layer.
This association works most of the time and for most of the data type but there are situation that we need to force this association to work the way we want.
Preparation
- To use the script below the csv file must be saved in the same folder that your qvd file
Qlik help example contains two tables: inline and from csv file(sample attached)
load dual ( string,numrep ) as DayOfWeek inline
[ string,numrep
Monday,0
Tuesday,1
Wednesday,2
Thursday,3
Friday,4
Saturday,5
Sunday,6 ];
Directory;
LOAD Date,
Sales
FROM
afile.csv
(txt, codepage is 1252, embedded labels, delimiter is ',', msq);
//The last line is not part of Qlikview help but you have to have this line to correctly load data into Qlikview
after Reload we have:

As you probably know when Values are on the left hand side they represent Text when on the right Number.
So why we have Text on the right?
In the background (during load) the numbers have been associated with the text.
So what you see is the bun what you do not is the underlay salad:

Practical use:
Example 1
The simple but maybe not the most
useful calculation
is to add Days of the week from our data
=sum(DayOfWeek)

Example 2
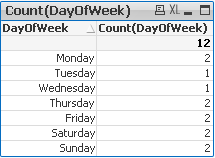
Counting days of the week:
Example 3
(please use attached xlsx file and below Script)
A survey has been conducted and the data in Excel file looks like this:
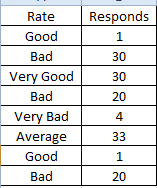
What we want is to assign more meaningful description to the rate numbers.
Script:
Data:
mapping load * Inline
[ Rate,Value
Very Good,5
Good,4
Average,3
Bad,2
Very Bad,1
]
;
Sort:
load
Responds,
dual(Rate,ApplyMap('Data',Rate)) as Rate
FROM
Survey.xlsx
(ooxml, embedded labels, table is Sheet1);
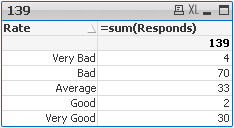
Now we can create Straight Table or bar Bar Chart:
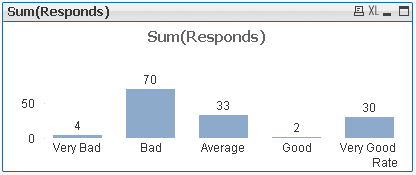
This function can be use in many different ways.Please research our community to find more examples.
Still feeling hungry?
Do you Qualify?- How to use QUALIFY statement
Missing Manual - GetFieldSelections() + Bonus Example
MaxString & MinString - How to + examples
The second dimension... or how to use secondarydimensionality()
-
How to use - MaxString & MinString
Bullet points:MaxString and MinString belongs to Qlikview String Aggregation function.They are equivalent to MAX and MIN for integersThey return the h... Show MoreBullet points:
- MaxString and MinString belongs to Qlikview String Aggregation function.
- They are equivalent to MAX and MIN for integers
- They return the highest and lowest string value
What actually a value of a string?
This is the value described by ANSI character standard where 0 ( NULL) is equal to 0 and ÿ to 255.
(For full ANSI character set please attached dosument)
Taking only the standard English alphabet (A-z) ‘A’ will be the MIN and ‘z’ will be the MAX.
Remember:
In ANSI standard A < a and Z < z
(A=65,Z=90,a=97,z=122)
Language specific characters will be not recognized in the place where they are in your alphabet but they will be 'pushed' to the end
(see ANSI table)
MinString and MaxString works on dimensions (columns) only so you cannot use is to evaluate single character or strings .
(MaxString(‘a’,’z’…) is not supported
Examples:
1) MIN & MAX (textbox)
Data Expression Results 
MinString(Category)
MaxString(Category)
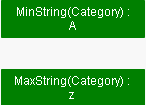
2) MIN and MAX of String per group (Straight table)
Data Expression Result 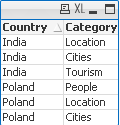
MinString(Category)
MaxString(Category)

3) With condition:
Return Max and Min string based on another column
We are looking for MIN and MAX string value from column Category where Country='Poland'
Data Expression Solution Result 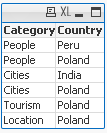
MinString( if(Country='Poland', Category, null()) )
MaxString( if(Country='Poland', Category, null()) )


4) With LEFT/RIGHT
When used with LEFT the result will be the same as without as the value will be still based on first characters.
Data Expression Solution Result 
=MinString( Right(Country,1))
=MaxString( Right(Country,1))


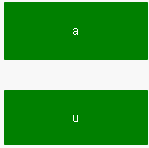
5) With MID
Data Expression Solution Result 
=MinString( Mid(Country,2,2))
=MaxString( Mid(Country,2,2))


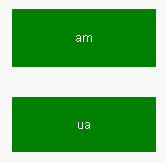
6) With Substring
When our data are little scrambled -TextBetween will return string between '.' and end of the row.
Data Expression Result 
=MinString(TextBetween(Country,'.','',1))
=MaxString(TextBetween(Country,'.','',1))

7) In set analysis
When Criteria of Sales is 2 return Country with highest and lowest string Value
Data Expression Result 
=MinString({<Sales={2}>} Country)
=MaxString({<Sales={2}>} Country)
😎 With Aggr()
For each Country return lowest and highest Category string value.
Data Expression Result 
=Aggr(Minstring(Category),Country)
=Aggr(Maxstring(Category),Country)

If know about other ways of using these functions please let me know.
-
QlikView App: Export Chart and Sheet to an Image File
This example shows how to call a macro that saves image files for a selected sheet and chart to a specified location on reload.The saved images could ... Show MoreThis example shows how to call a macro that saves image files for a selected sheet and chart to a specified location on reload.
The saved images could then be published via a web site or Wall Board, for example.
This QlikView was written in response to a post in the QlikView UK user group.
For other tutorial apps you can download and use, please see:
https://www.quickintelligence.co.uk/qlikview-examples/
Hope you find this app useful.
Steve Dark
-
Missing Manual - Peek()
Have you ever wondered how the examples from the Qlikview help may look like?Please see below and enjoy responsibly...Peek()not a boo...... Show More
Have you ever wondered how the examples from the Qlikview help may look like?
Please see below and enjoy responsibly...
Peek()
not a boo...
This function belongs to to Inter-Record functions and can only be used in the script (back-end).

Description(Qlikview Help)
Returns the contents of the fieldname in the record specified by row in the internal table tablename. Data are fetched from the associative QlikView database.
Fieldname must be given as a string (e.g. a quoted literal).
Row must be an integer. 0 denotes the first record, 1 the second and so on. Negative numbers indicate order from the end of the table. -1 denotes the last record read.
If no row is stated, -1 is assumed.
Tablename is a table label without the ending colon. If no tablename is stated, the current table is assumed. If used outside the load statement or referring to another table, the tablename must be included.
Syntax:

Field_name - is a name of of your field(column)
row_no - the row from which the data is returned
(0 is first row
1 is second row
and so on..
-1 is the last row)
table_name - a name of table from where the data are fetched

Returns values from previous row or row specified by the row-no argument.
- If no row is stated, -1 is assumed.
- you can reference field that was not been previously loaded (created on the with AS alias)(See "Bonus 2" example)
- From the Help description "Fieldname must be given as a string (e.g. a quoted literal)."
This is true only if we use this function to create variable (please see below examples)
Data Model
(Copy and Pasted below code into Edit Script window and reload)Tab1:
load
peek(Sales) as S1,
peek( Sales,2 ) as S2,
peek( Sales,-2 ) as S3,
if(rowno()=1,Sales,Peek(RunnigTotal,-1)+Sales) as RunnigTotal,
Previous(Sales) as PSales,
numsum( Sales, peek( 'Sales' ) ) as Bsum,
Sales
inline [
Sales
100
200
300
400
]
;
load
peek( Sales, 0, 'Tab1' )as S4
resident Tab1;
LET vpeek= peek( 'Sales', -1, 'Tab1' ) ;
 Please see below swuehl comments about difference when you use negative or positive numbers as second argument.
Is worth to mention that Peek() is reading from Output table(opposite to Previous() function which reads from Input Table.
Example:
OutputTable:
LOAD field
RESIDENT InputTable;
source:Difference between peek() and previous() funcation
Example 1
In this example as we did not specify the row_no argument, all but last rows are returned.
peek( 'Sales' )
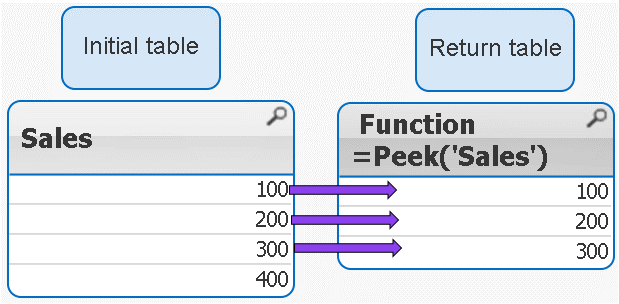
 peek( 'Sales' ) = peek( 'Sales',-1)
Example 2
IF the row_no argument is added only ONE value is returned
peek( 'Sales',2 )
 Remember 2 = third row
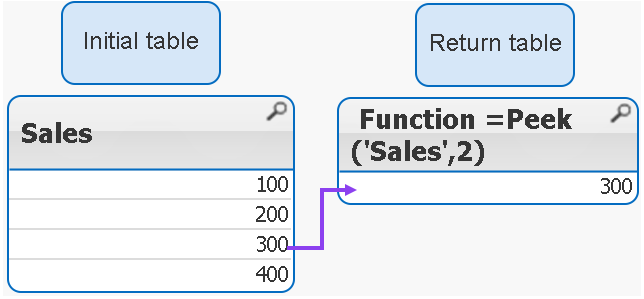
Example 3
If we use negatives numbers as row_no the return value is our initial table minus number of rows specified by the second argument.
peek( 'Sales',-2 )

As you see the last 2 rows have been removed from the table.
Example 4
The below syntax is used when we want to return value from external table(see data model)
peek( 'Sales', 0, 'Tab1' ) as S4

Example 5
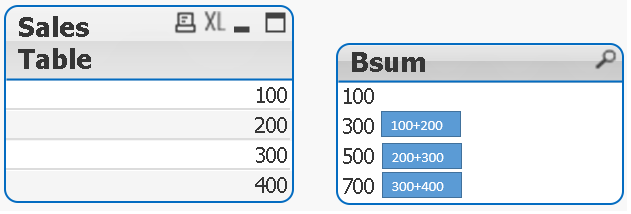
Each row is a SUM of current row + one row above.
numsum( Sales, peek( 'Sales' ) ) as Bsum
Bonus
How to store value into variable:
With below example
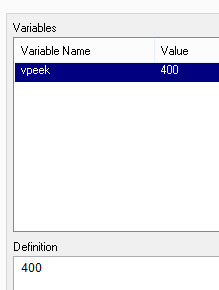
LET vpeek= peek( 'Sales', -1, 'Tab1' ) ;
we will store value of 400 in variable vpeek
and then use in front end development.
Bonus 2
As previously stated we can use Peek to return values from field that was not been yet created.
How does it wok?
In our data model we have this line:
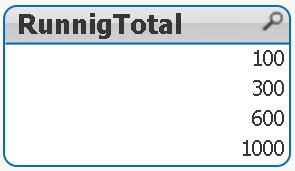
if(rowno()=1,Sales,Peek(RunnigTotal,-1)+Sales) as RunnigTotal,
Although RuningTotal has not yet been loaded we can return the values from that line:
Still feeling Qlikngry?
-
Missing Manual - GetFieldSelections() + Bonus Example
Have you ever wondered how the examples from the Qlikview help may look like?Please see below and enjoy responsibly... GetFieldSelections()Definition:... Show MoreHave you ever wondered how the examples from the Qlikview help may look like?
Please see below and enjoy responsibly...
GetFieldSelections()
Definition:
Returns a string with the current selections in a field.

valueSep - is the separator to be put between field values. The default is ', '.
max_values - is the maximum number of field values to be individually listed.
When a larger number of values is selected the format 'x of y values' will be used instead.
The default is 6.
Preparation:
Script to play with:
Load * Inline
[
Year
2007
2008
2009
2010
2011
2012
2012
2013
2014
2015
2016
]
Example 1:
GetFieldSelections(Year )
Our field Year has 10 values (Years from 2007 to 2016)
The default separator is ',' (coma)
The maximum default numbers of values is 6
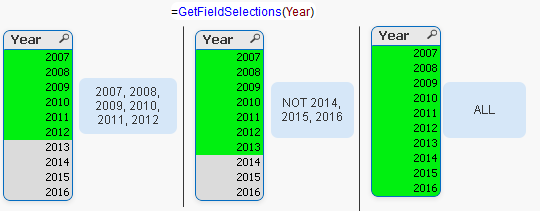
We used the same expression for all 3 sets of data
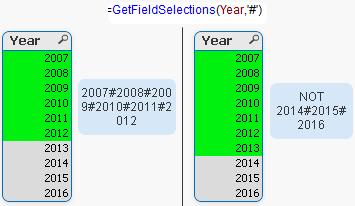
Left: Selection of 6 values
Middle: When more that 6 values the result will change to show the values which are not selected.
Right: Selecting whole sets of values will return 'ALL' as result
Data Expression and Results 
Example 2: valueSep
We can assign here any character (or string).
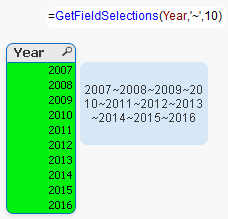
Examples 3: max_values
The default values of 6 is overwritten by the value we have specified(10)
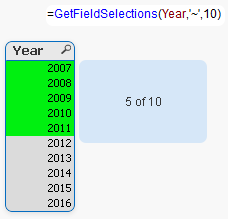
Interesting:
When playing with this function somehow I managed to get result like below
If you can replicate it please post it.
Bonus:
Practical use:
Still feeling hungry?
Do you Qualify?- How to use QUALIFY statement
Missing Manual - GetFieldSelections() + Bonus Example
MaxString & MinString - How to + examples
The second dimension... or how to use secondarydimensionality()
-
Incremental Load in Qlikview - Sources
Hi All,This is the collection of Incremental Load in Qlikview.Hope this will help you.Thank you.Incremental Load.docxScript for Incremental Loading of... Show MoreHi All,
This is the collection of Incremental Load in Qlikview.
Hope this will help you.
Thank you.
Script for Incremental Loading of Multiple QVDs from a List of Table Names
Incremental Load Scenarios.pdf
incremental load issue while executing
Different Ways to load data in qlikview
Partial Reload Easy and Simple
Switch Between Full Load And Incremental Load
Re: Incremental Load in Script
Concatenate Incremental logic for Deleted records
-
Expression Scene Investigation, E1: Moving Average
( based on a true story)Cast:SUM(),ABOVE(),RANGESUM()Case:Return Average of last 3 months(not including cur... Show More
( based on a true story)
Cast:
SUM(),ABOVE(),RANGESUM()
Case:
Return Average of last 3 months(not including current one)
Preparation:
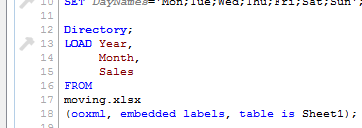 Using data from attached Excel file and script from txt load data into Qlikview.
(Click on picture to see full size)
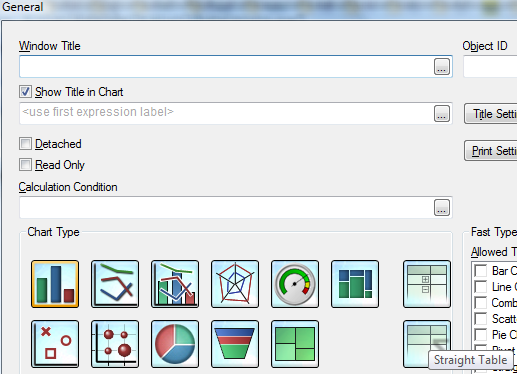
Create Straight Table (Layout-->New Sheet Object-->Chart...) -->

Use:
Year and Month
as dimension -->

and Sales as expression.
(In this example Sales and SUM(Sales) deliver the same results as we have unique values in Month dimension. -->
Investigation:
The expression we are going to take apart is:
Rangeavg(Above(Sum(Sales),1,3))
Step 1) SUM()
The syntax of SUM in Qlikview is quite complicated when used in charts:

(We not going to investigate that now so please refer to Qlikview Help for more details)
For our example we only need:
SUM(Sales)
The result of this expression is:
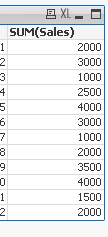
Step 2) ABOVE()

ABOVE takes 3 parameters:
expression - which in our example is: SUM(Sales).(we are ignoring the total here)
offset- this is integer value(0,1,2...) to specify how many rows the whole expression should be move down in relation to current row
n - this is integer value(1,2...) and will return range of values.
Remember:

The last parameter will only work when used as argument with another Chart Range Function
(please see Qlikview Help for details)
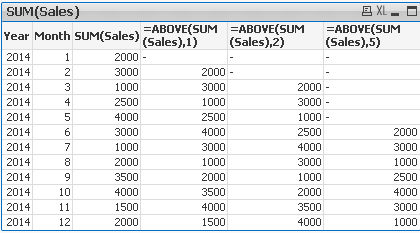
The result of wrapping SUM with ABOVE
ABOVE(SUM(Sales),offset)
is presented below.
Offset of 1,2 and 5 rows:
Step 3) Rangeavg()

This function returns average of values or expressions:
Rangeavg(1,1) =1
Rangeavg(1,2,3)=2
RangeAvg(sum(1+2),sum(2+3)) is equal to RangeAvg(3,5)=4
Step 4)
So what actually is going on behind the scene we we use:
Rangeavg(Above(Sum(Sales),1,3))?
We can rephrase that expression to:
" Sum values from dimension Sales then go 1 row above and take values from 3 rows going up"
So based on our example :
 Row one:
Will always return NULL
as we can not got above row 1 -->
Rangeavg()=NULL
Row two:
"Go up 1 row and return 3 values".We can only go 1 row up and return 1 value
Rangeavg(2000) = 2000
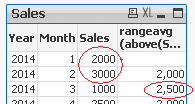
Row three:
"Go up 1 and return 3 values going up"
We can only go 2 rows up:
Rangeavg (2000,3000) =
(2000+3000)/2=2500
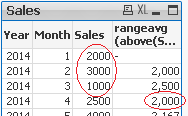
Row four:
"Go up 1 row..."
This is first row where values from 3 rows above
can be returned(Row 1, Row 2 ,Row 3)
Rangeavg(Row 1, Row 2 ,Row 3) = Rangeavg(2000+3000+1000)=6000/3=2000

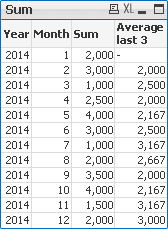
Row five:
Rangeavg(Row 2, Row 3 ,Row 4)
=Rangeavg(3000+1000+2500)=6500/3=2167
and so on...
The final result:
Conclusions:
The offset parameter of the ABOVE function according to Qlikview Help:
"Specifying an offset greater than 1 lets you move the evaluation of expression to rows further up the current row"I would say : greater that 0 as any values equal or greater than 1 will shift the expression down.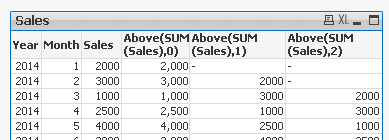 In addition I would describe behaviour of the offset as:"The offset parameter shifts the whole expression by n (where n is integer greater than 0) rows down".This is maybe personal way of writing but I found that easier to understand.Case closed..?


