Unlock a world of possibilities! Login now and discover the exclusive benefits awaiting you.
- Qlik Community
- :
- Support
- :
- Support
- :
- Knowledge
- :
- Support Articles
- :
- Qlik Products: Save network web traffic (HAR/XML f...
- Subscribe to RSS Feed
- Mark as New
- Mark as Read
- Bookmark
- Subscribe
- Printer Friendly Page
- Report Inappropriate Content
Qlik Products: Save network web traffic (HAR/XML file) and console logs from the browser's developer tools
- Mark as New
- Bookmark
- Subscribe
- Mute
- Subscribe to RSS Feed
- Permalink
- Report Inappropriate Content
Qlik Products: Save network web traffic (HAR/XML file) and console logs from the browser's developer tools
Nov 21, 2025 6:00:33 AM
Mar 16, 2016 10:20:21 AM
This article explains how to save network logs in web development tools and the console logs from the browser and how to capture and read client-side response trace with HAR file analyzer.
The article can be applied to different products, such as Qlik Cloud Analytics, Qlik Talend Cloud, or Qlik Sense Enterprise on Windows.
For Qlik Sense, it is essential that the trace is started before Qlik Sense login so that WebSocket creation is captured.
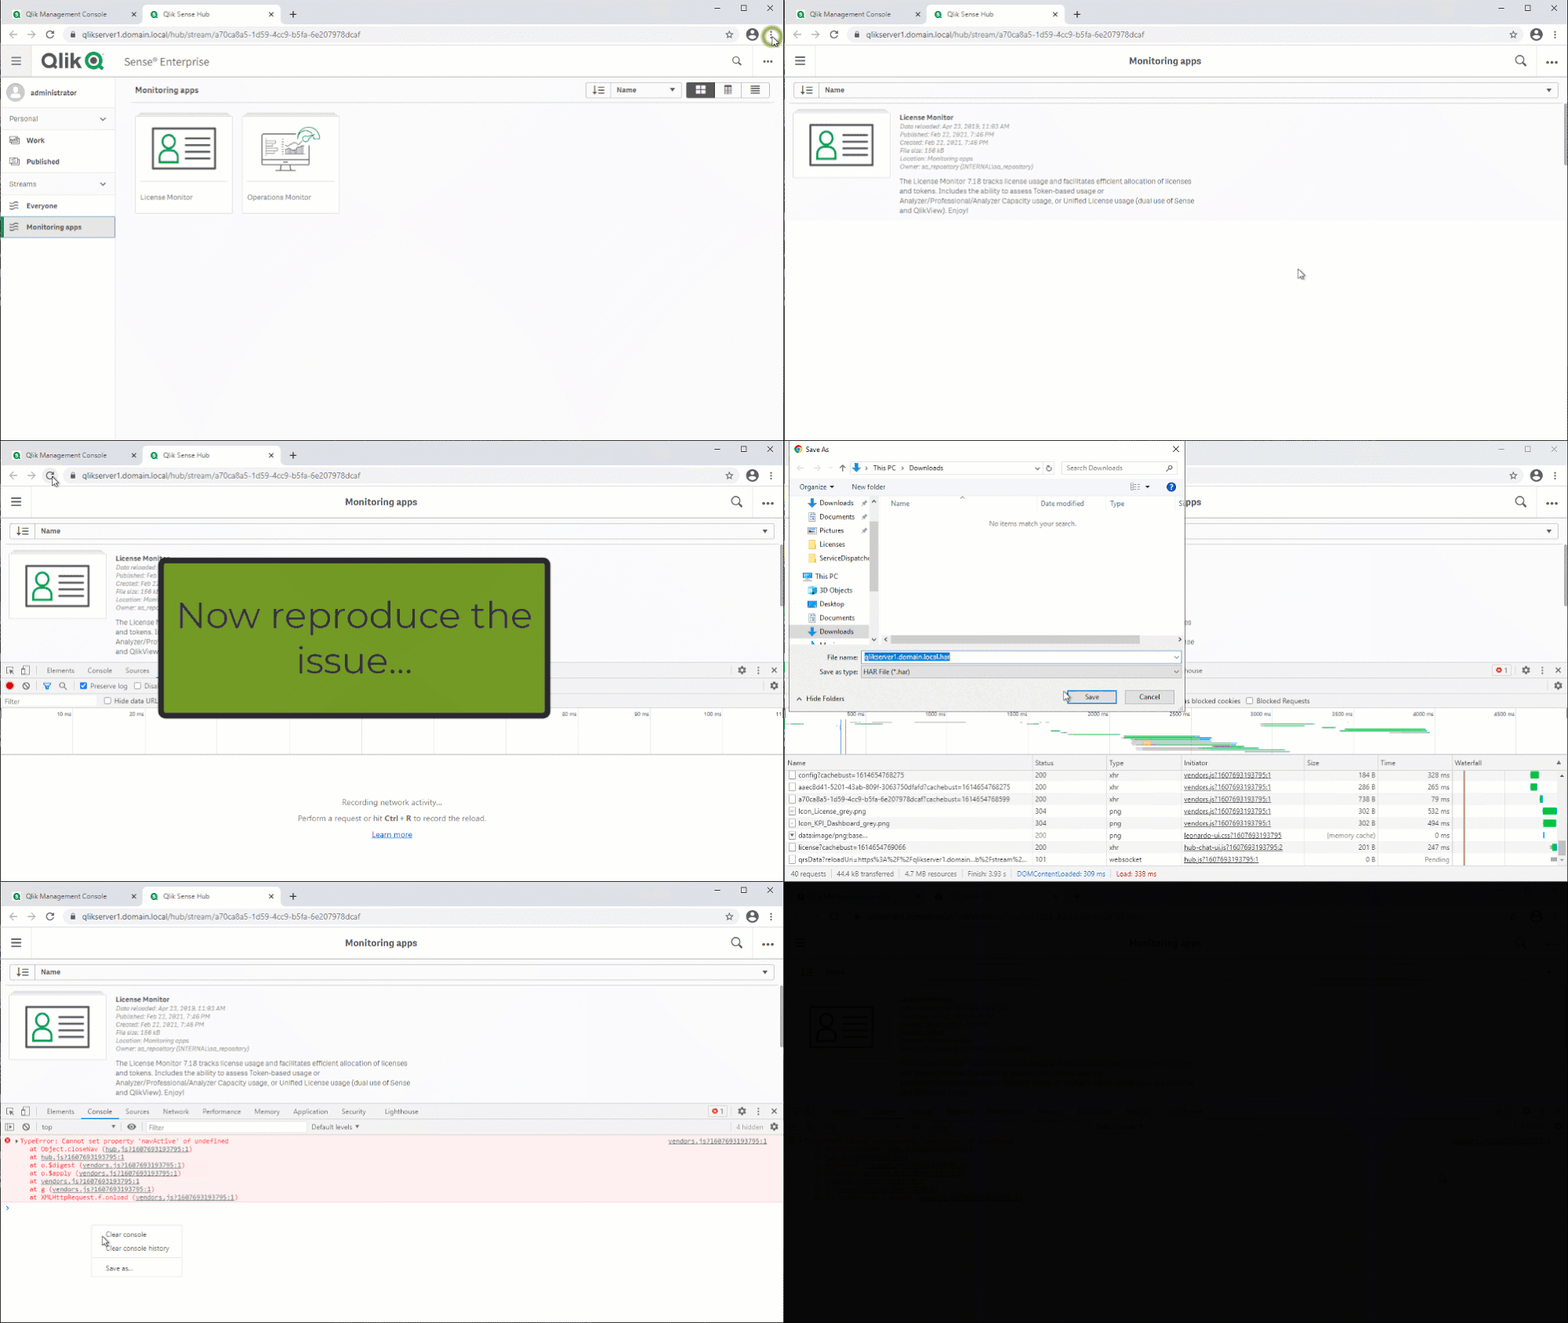
Google Chrome and Microsoft Edge (new Chromium version):
- Open developer tools (Menu > More tools > Developer tools or Ctrl + Shift + I or F12)
- Select the Network tab.
- Make sure that "Preserve log" is checked so that all traffic is captured.
- Access or refresh the page traffic needs to be captured for or a problem should be reproduced in
- Perform the steps to cause the behavior/issue
- Click on the down arrow "Export HAR..." button or Right-click within the Network capture pane then choose 'Save as HAR with content' and save the .har capture locally.
- Click on the Console tab > right-click > Save As > Save on the .log file
To read the files, use a tool such as the HAR Analyzer https://toolbox.googleapps.com/apps/har_analyzer/
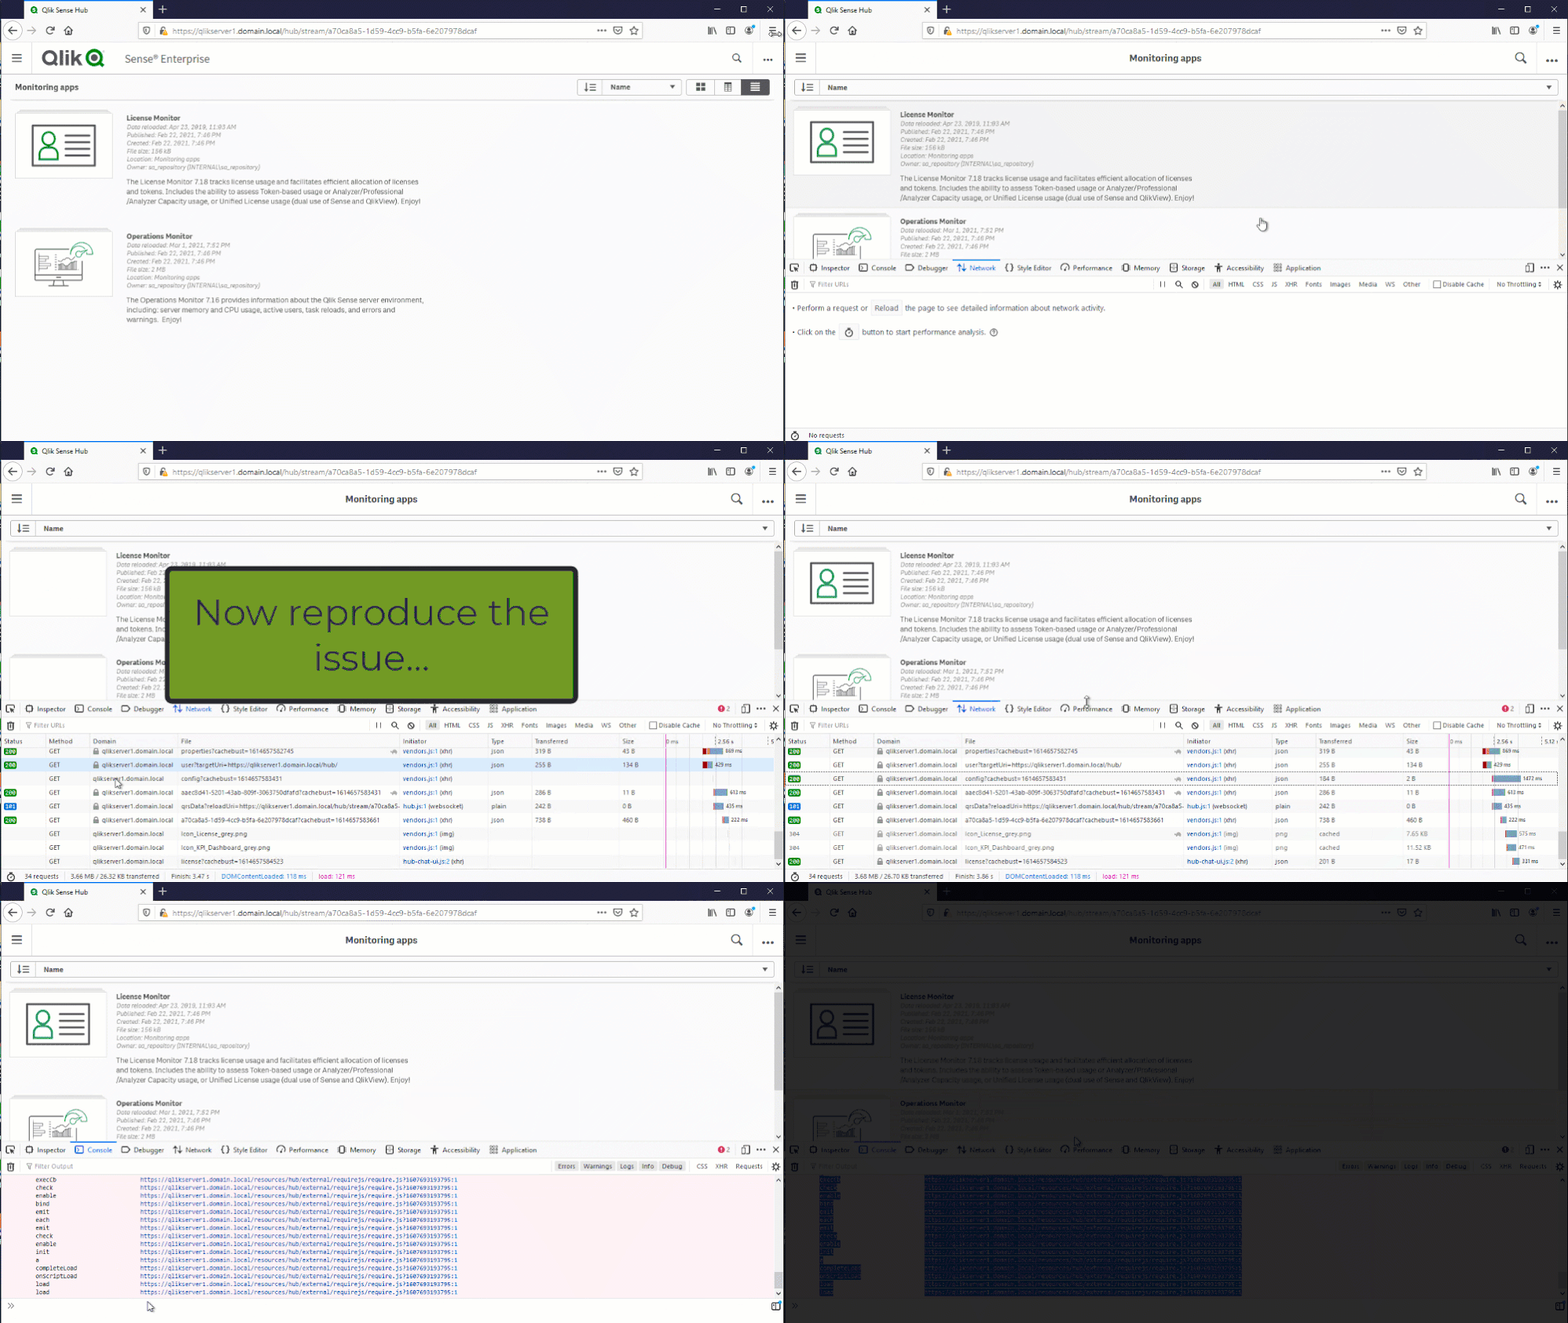
Firefox (41+) :
- Go to Menu > Web Developer > Network
- Reload the page you want to get the log for
- Perform the steps to cause the behavior/issue.
Note: For Qlik Sense it is important that the trace is started prior to Qlik Sense login so that WebSocket creation is captured. - Right-click > Save All as HAR
- Click on Console tab, Right-click > Select All.
- Right-Click > Export Visible Message To > File, and save on a .txt file.
Internet Explorer and Microsoft Edge (older versions):
- Open Developer Tools (F12)
- Go to the network tab and click on the green arrow to start the tool
- Refresh the page to capture the logs
- Perform the steps to cause the behavior/issue
- Note: For Qlik Sense it is important that the trace is started prior to Qlik Sense login so that WebSocket creation is captured.
- Click 'Export captured traffic' icon and choose XML or HAR format.
- Click on Console tab > right-click > Copy All, and paste it / save on a .txt file.
To read the files, use a tool such as the HAR Analyzer https://toolbox.googleapps.com/apps/har_analyzer/
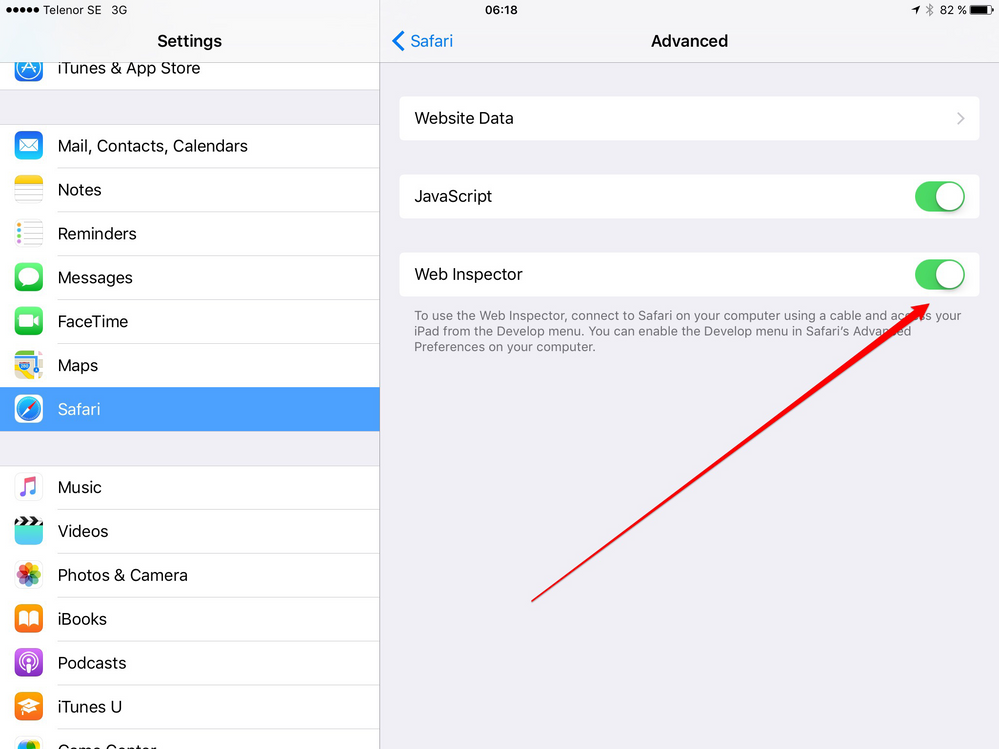
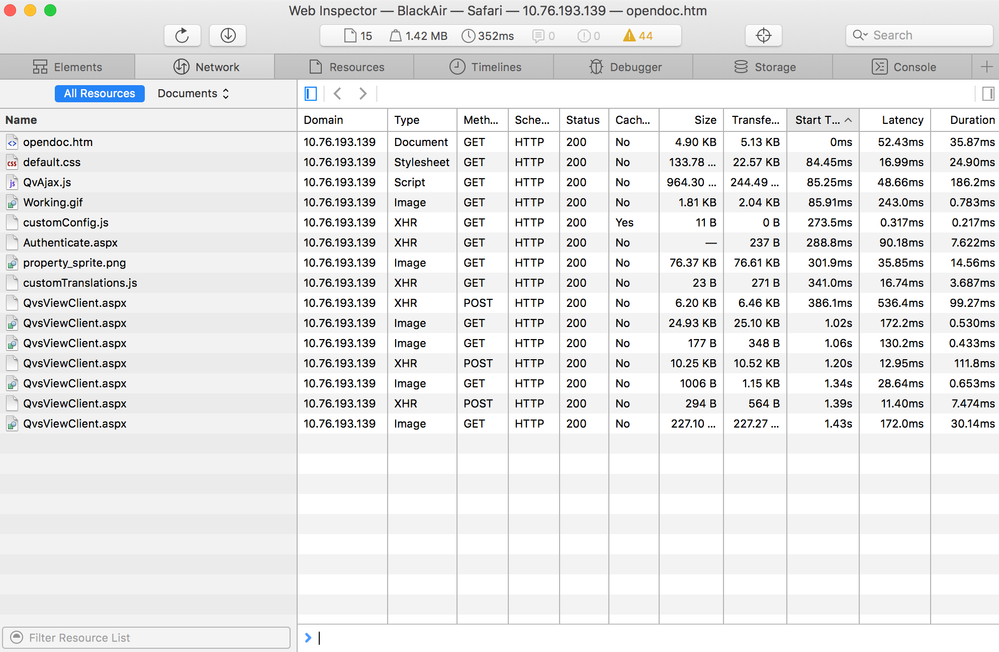
iPad or iPhone Safari:
- On the iPad or iPhone, open the Settings app and go to Safari, Advanced. Enable the Web Inspector.
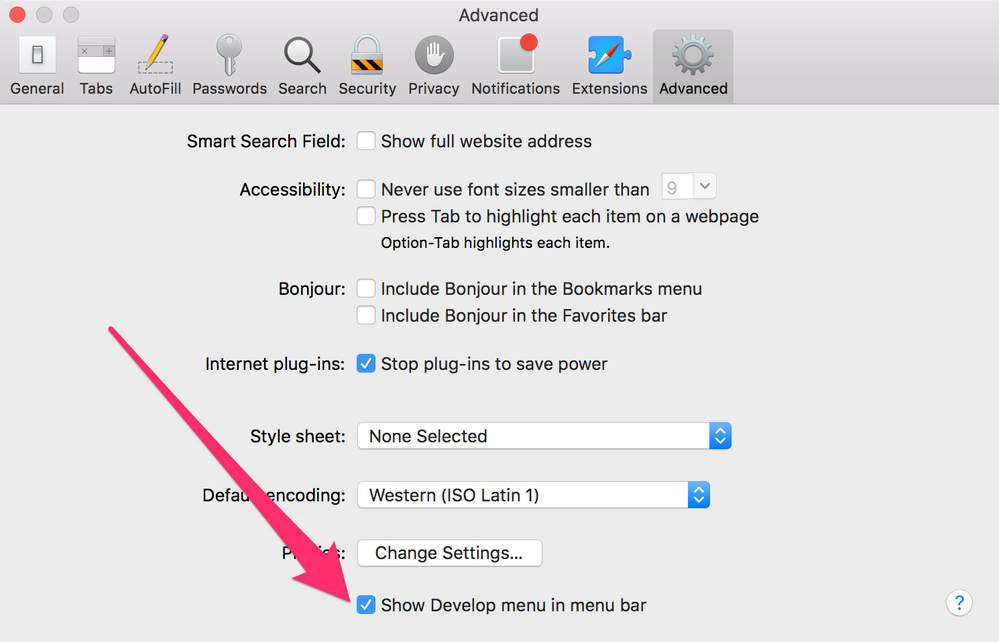
- On the Macintosh, launch Safari --> Preferences --> Advanced --> Show Develop menu in tab bar
Further Troubleshooting
- On the iPad/iPhone, access the QlikView / Qlik Sense site you are having issues with
- On the Mac, launch Safari --> Develop menu --> pick the name of the iOS device and select the site to inspect.
- The Web inspector will launch. Select Networking and then, on the iOS device, start reproducing the issue.
The Web Inspector can be used not only with iOS devices, but also with the iOS Simulator for Mac. Please, check the "How to simulate iOS Safari on a Mac" article.
- Mark as Read
- Mark as New
- Bookmark
- Permalink
- Report Inappropriate Content
You should add a note that for Qlik Support engineers to get the HAR file they should provide you with a file share address that can accept large files.
