Unlock a world of possibilities! Login now and discover the exclusive benefits awaiting you.
- Qlik Community
- :
- Blogs
- :
- Technical
- :
- Design
- :
- Recipe for a Memory Statistics analysis
- Subscribe to RSS Feed
- Mark as New
- Mark as Read
- Bookmark
- Subscribe
- Printer Friendly Page
- Report Inappropriate Content
In a previous blog post I described the internal data tables and the symbol tables. (See “Symbol Tables and Bit-Stuffed Pointers”). These tables constitute the QlikView internal data model. Then there are the state space vectors that keep track of the user’s selections (See “Colors, states and state vectors”).
In addition to these, there are other structures used to calculate the sheet objects. Sometimes a sheet object can use quite a lot of memory, e.g., a chart with many dimensions.
Often you need to ask yourself – “What in this application uses a lot of memory? What can I improve or optimize?” Is it the data model itself or is it the symbol tables? Or is there a chart that uses a lot of memory?”
To get an answer to these questions, you can use the memory statistics tool. Here follows a basic recipe for a memory analysis:
- Create a memory statistics file from the application you want to analyze (Document Properties -> General -> Memory Statistics). This will export some memory statistics data to a tab separated file.
- Create a new QlikView document in which you load the created file.
- Create list boxes for the fields Class, Type, and Subtype.
To understand what these fields display, see the table below.
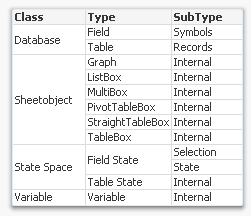
The Class field tells you whether the memory used is part of the internal database (data tables and symbol tables), the state space (the selections), the sheet objects (volatile structures to calculate the sheet objects), or a variable. The Type and SubType fields give you additional information about where memory is used.
- Create a drill-down group of the fields Class, Type, and Subtype named ">Type".
- Create a stacked bar chart with Id as first dimension, >Type as second dimension, and Sum(Bytes) as expression.
- Sort the chart descending according to y-value.
- Restrict the chart to show only the first 10 bars.
You should now have a graph similar to the one below.
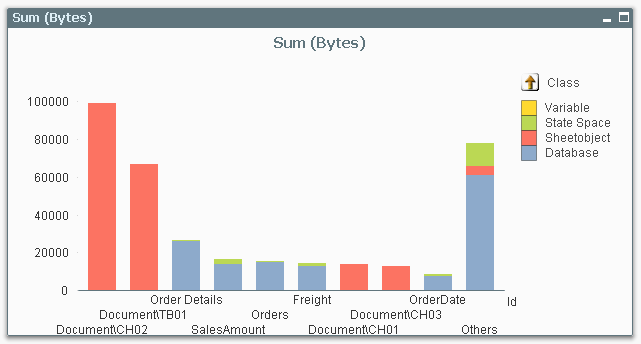
In this you can see which objects, tables, or fields are consuming memory in your application. The bars to the left are the ones that use a lot.
Now you can start to optimize!
If most of your memory consumption is made by sheet objects, look at them and see if there is anything you can do. Does this chart have too many dimensions? Is the expression too complex? Do I really need to sort this list box with a very large number of distinct values? Do I need to show it at all?
If most of your memory consumption is due to database symbols, look at whether you can use the autonumber function to make these symbol tables use less memory.
If most of your memory consumption is made by database tables, you might want to remove columns, or aggregate data. Or maybe realize that optimization isn’t worth wile…
One small word of warning: The numbers in the memory statistics analysis should not be trusted too literally – they do not always describe the situation completely. For instance, if a calculation is cached, it will not show up in the memory usage. Further, if an object has not been opened yet, its memory consumption is unknown and will display as zero. But in spite of these shortcomings, the memory statistics function will most of the time help you find where memory is used.
- « Previous
-
- 1
- 2
- 3
- Next »
You must be a registered user to add a comment. If you've already registered, sign in. Otherwise, register and sign in.