Unlock a world of possibilities! Login now and discover the exclusive benefits awaiting you.
- Qlik Community
- :
- All Forums
- :
- Qlik NPrinting
- :
- NPrinting Powerpoint report
- Subscribe to RSS Feed
- Mark Topic as New
- Mark Topic as Read
- Float this Topic for Current User
- Bookmark
- Subscribe
- Mute
- Printer Friendly Page
- Mark as New
- Bookmark
- Subscribe
- Mute
- Subscribe to RSS Feed
- Permalink
- Report Inappropriate Content
NPrinting Powerpoint report
Hello All,
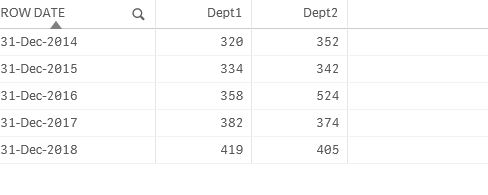
I am trying to build a Powerpoint report using Qlik NPrinting. I have a Qlik Sense app that has the objects for the report. I want to create the attached chart. I am using a straight table in QS, i have attached a picture of the straight table- titled nprint_file2.jpg.
I am able to create the chart in NPrinting powerpoint, however the chart is not in the same format that I need, it is created by each row date instead of by showing by each Department. Attached is the output file, titled 'output_nprinting.jpg'.
I tried to switch row/columns, however this is not working as intended. Any help would be very appreciated.
- Mark as New
- Bookmark
- Subscribe
- Mute
- Subscribe to RSS Feed
- Permalink
- Report Inappropriate Content
Hi,
This is down to modelling your data in Qlik Table. Currently you are using end of year (date) as dimension and you have 2 measures (by Department) with probably set analysis in it.
What you need is a Qlik Table with Department as Dimension and Years as columns. So the exercise has to be done on Qlik end and then delivered in the right format to NPrinting.
Table in Qlik Sense needs to look like this:

Then you build your template like this:

this is result you will get - looks to me like the one you wanted

At the end we are limited to what we can do in Power Point and we have to deliver data in the format which will support it.