Unlock a world of possibilities! Login now and discover the exclusive benefits awaiting you.
- Qlik Community
- :
- All Forums
- :
- Qlik NPrinting
- :
- Re: how to create the line chart in Nprinting nove...
- Subscribe to RSS Feed
- Mark Topic as New
- Mark Topic as Read
- Float this Topic for Current User
- Bookmark
- Subscribe
- Mute
- Printer Friendly Page
- Mark as New
- Bookmark
- Subscribe
- Mute
- Subscribe to RSS Feed
- Permalink
- Report Inappropriate Content
how to create the line chart in Nprinting november 2017 Pixel Perfect template
Hi Team,
I am using qliksense, Nprinting to develop reports.
My requirement is like below.
Step1:
I have designed simple table with the data .
SampleTable:
Load * Inline
[
Date1, Sales
01/20/2018, 20000
01/30/2018, 40000
05/02/2018, 35000
05/03/2018, 15000
05/04/2018, 21000
05/07/2018, 22000
05/09/2018, 26000
05/11/2018, 31000
05/12/2018, 55000
05/13/2018, 44000
05/15/2018, 9000
05/21/2018, 94000
05/30/2018, 21000
05/31/2018, 27500
];
In the front end, I create the line chart with the Date1 as dimension and Sum(Sales) as measure. Measure format is Number without decimal point.
I published this into QMC and got the ID.
Step2: I create the new app in Nprinting and created the connection with the above generated ID.
Step3: Created the Report with the format Pixel Perfect. Opened the Nprinting Designer and I got the Pixel Pefect template window.
Here i started creating the Line chart. Below are the selection steps.
Step A: Added the created chart into table option displayed in the field list window
Step B: Double click on the Chart option in the tools menu and selected the Line chart
Step C: Selected the color palette and select the Single Series (series 1) by removing the Series 2.
Step 😧 Changed the series name as "Sales by Date"
Step E: Moved to Data Tab and select Series binding tab
Step F: Select the Argument as "Date1", Value as "Sum(Sales)
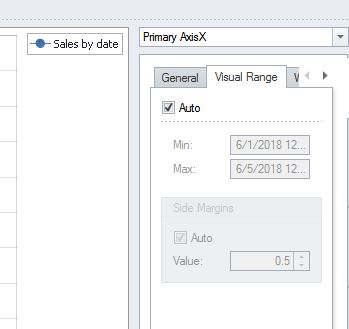
Step G: moved to Axis tab and select the range as Auto, The values in the auto range is showing this month 1st and 2nd
when i am trying to change the range, it is not taking the proper dates.
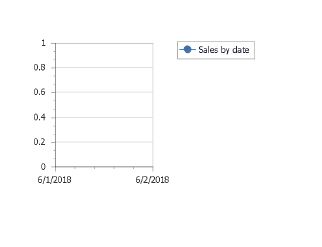
When I am previewing, It is not showing the data in my chart. Also, it is taking the Current month dates in the chart before preview.
Attached the X - axis visibility before preview, also the end result.
X- axis visibility:
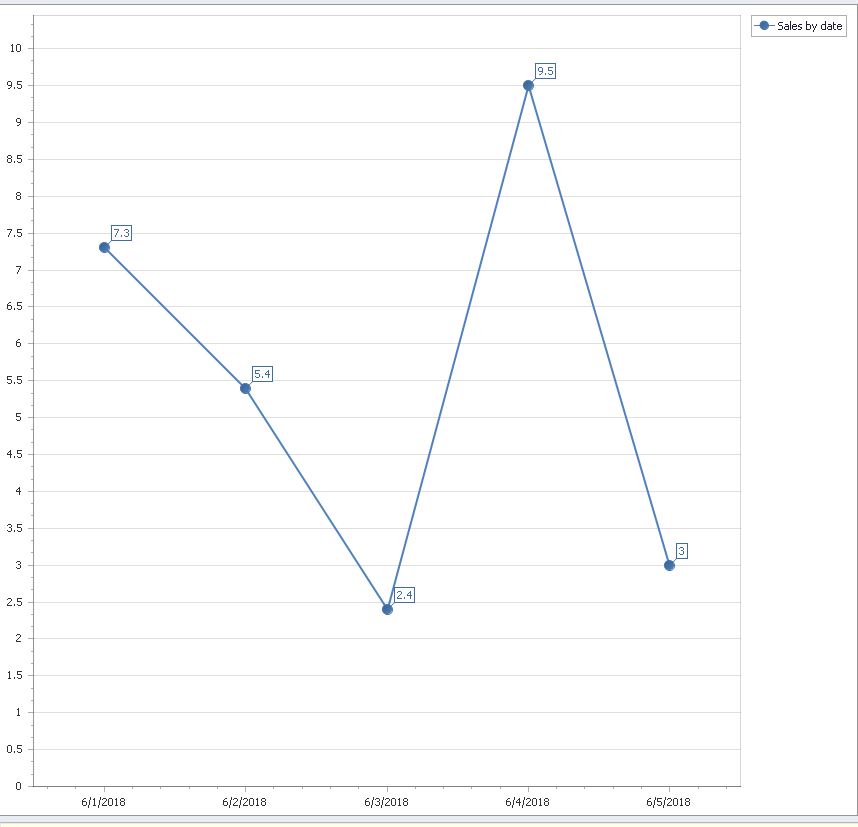
End Result
Auto Range values:
My problem is, I am not able to change this date range and Nprinting is not taking the date range as per my dimension. Please help me how to get the actual dates from my dimension.
Regards
Srinivas
- Mark as New
- Bookmark
- Subscribe
- Mute
- Subscribe to RSS Feed
- Permalink
- Report Inappropriate Content
Hi Team,
Did anyone worked on pixel perfect, Please reply to my post.
Regards
Srinivas
- Mark as New
- Bookmark
- Subscribe
- Mute
- Subscribe to RSS Feed
- Permalink
- Report Inappropriate Content
Hi,
I did a test and I had the same result.
In my opinion you should use Qlik NPrinting filters and apply them to the user, the task or the report.
Best Regards,
Ruggero
---------------------------------------------
When applicable please mark the appropriate replies as CORRECT https://community.qlik.com/docs/DOC-14806. This will help community members and Qlik Employees know which discussions have already been addressed and have a possible known solution. Please mark threads as HELPFUL if the provided solution is helpful to the problem, but does not necessarily solve the indicated problem. You can mark multiple threads as HELPFUL if you feel additional info is useful to others.
Best Regards,
Ruggero
---------------------------------------------
When applicable please mark the appropriate replies as CORRECT. This will help community members and Qlik Employees know which discussions have already been addressed and have a possible known solution. Please mark threads with a LIKE if the provided solution is helpful to the problem, but does not necessarily solve the indicated problem. You can mark multiple threads with LIKEs if you feel additional info is useful to others.
- Mark as New
- Bookmark
- Subscribe
- Mute
- Subscribe to RSS Feed
- Permalink
- Report Inappropriate Content
Did you find a solution for this issue?
I have a similar requirement where line chart not displaying all the dates.
- Mark as New
- Bookmark
- Subscribe
- Mute
- Subscribe to RSS Feed
- Permalink
- Report Inappropriate Content
Hi Prem,
Nprinting 17 I used to design the line chart. It won't take the date as number. You need to have two columns in your script.
1. Original Date column
2. Text column for the date. For example Text(Date(today())).
what you need to do is, apply the set analysis on the original date in your expression and Display text column on your X-axis to see all the dates in the line chart.
Please let me know if you find any difficulty in doing this.
Regards
srinivas
- Mark as New
- Bookmark
- Subscribe
- Mute
- Subscribe to RSS Feed
- Permalink
- Report Inappropriate Content
Hi,
I did some other tests.
1 - Be sure that the numbers are loaded into Qlik as decimals not integer
Sales:
Load * Inline
[
Date, Sales
01/20/2018, 20000.0
01/30/2018, 40000,0
05/02/2018, 35000,0
05/03/2018, 15000,0
05/04/2018, 21000,0
05/07/2018, 22000,0
05/09/2018, 26000,0
05/11/2018, 31000,0
05/12/2018, 55000,0
05/13/2018, 44000,0
05/15/2018, 9000,0
05/21/2018, 94000,0
05/30/2018, 21000,0
05/31/2018, 27500,0
];
2 - Create the PixelPerfect chart
3 - Apply Qlik NPrinting filters, not the PixelPerfect range filter. If you need to keep data of a month or of a year it is better to create them as fields in the source app because Qlik NPrinting June 2018 does not support a filter by range (like date between a minimum and a maximum). You need to list the values you want to keep.
Best Regards,
Ruggero
---------------------------------------------
When applicable please mark the appropriate replies as CORRECT https://community.qlik.com/docs/DOC-14806. This will help community members and Qlik Employees know which discussions have already been addressed and have a possible known solution. Please mark threads as HELPFUL if the provided solution is helpful to the problem, but does not necessarily solve the indicated problem. You can mark multiple threads as HELPFUL if you feel additional info is useful to others.
Best Regards,
Ruggero
---------------------------------------------
When applicable please mark the appropriate replies as CORRECT. This will help community members and Qlik Employees know which discussions have already been addressed and have a possible known solution. Please mark threads with a LIKE if the provided solution is helpful to the problem, but does not necessarily solve the indicated problem. You can mark multiple threads with LIKEs if you feel additional info is useful to others.