Unlock a world of possibilities! Login now and discover the exclusive benefits awaiting you.
- Qlik Community
- :
- All Forums
- :
- QlikView App Dev
- :
- Re: Child Distribution on pie chart
- Subscribe to RSS Feed
- Mark Topic as New
- Mark Topic as Read
- Float this Topic for Current User
- Bookmark
- Subscribe
- Mute
- Printer Friendly Page
- Mark as New
- Bookmark
- Subscribe
- Mute
- Subscribe to RSS Feed
- Permalink
- Report Inappropriate Content
Child Distribution on pie chart
Hi,
I have a master data table with a hierarchy of budgets.
| BudgetUID | Name | ParentBudgetUID | javascript:;Sum |
|---|---|---|---|
| 1 | General | - | 1000 |
| 2 | System 1 | 1 | 150 |
| 3 | System 2 | 1 | 100 |
I have been try to demonstrate distribution structure on pie chart as shown in the screen.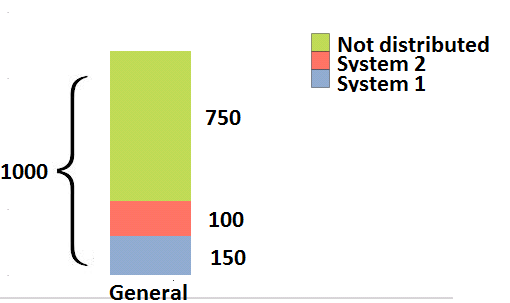
I have tried set analysis to calculate sum of budget pieces, but unsuccessfully .
Appreciate if someone could help on this.
- Mark as New
- Bookmark
- Subscribe
- Mute
- Subscribe to RSS Feed
- Permalink
- Report Inappropriate Content
Create a pie chart with no dimension and three expressions:
Not distributed: sum([javascript:;sum]) - sum({<PartentBudgetUID={1}>}[javascript:;sum])
System 1: sum({<Name={'System 1'}>}[javascript:;sum])
System 2: sum({<Name={'System 2'}>}[javascript:;sum])
talk is cheap, supply exceeds demand
- Mark as New
- Bookmark
- Subscribe
- Mute
- Subscribe to RSS Feed
- Permalink
- Report Inappropriate Content
Thanks, but i need a little more help  It is clear only for these specific values (one parent, two systems). And what about there are many objects with different systems and parents. How can i define set analysis without specific system/parent values?
- Mark as New
- Bookmark
- Subscribe
- Mute
- Subscribe to RSS Feed
- Permalink
- Report Inappropriate Content
You can't. There has to be a link between systems and parents. All records of the same 'family' need an identifier that uniquely identifies the family. Perhaps you can remodel your data using the hierarchy function.
talk is cheap, supply exceeds demand
- Mark as New
- Bookmark
- Subscribe
- Mute
- Subscribe to RSS Feed
- Permalink
- Report Inappropriate Content
But i have all the fields generated by 'Hierarchy' function such as UID, ParentUID, NodeName, Depth.
- Mark as New
- Bookmark
- Subscribe
- Mute
- Subscribe to RSS Feed
- Permalink
- Report Inappropriate Content
You didn't mention that before. I can't read minds so I don't know anything about your data if you don't tell me. If you used the hierarchy function you should already have the fields you need. Perhaps you can post a qlikview document with the data so somebody can create a solution for you.
talk is cheap, supply exceeds demand
- Mark as New
- Bookmark
- Subscribe
- Mute
- Subscribe to RSS Feed
- Permalink
- Report Inappropriate Content
sorry 
See in attachment for example and preferred result.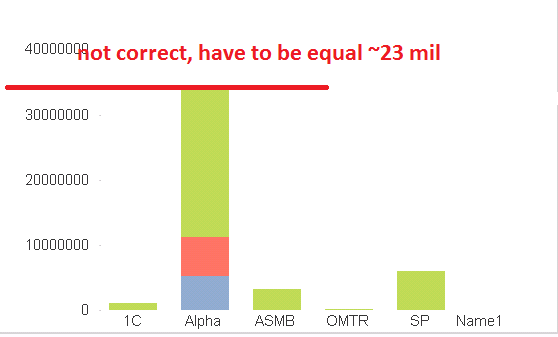
- Mark as New
- Bookmark
- Subscribe
- Mute
- Subscribe to RSS Feed
- Permalink
- Report Inappropriate Content
See attached qvw.
talk is cheap, supply exceeds demand
- Mark as New
- Bookmark
- Subscribe
- Mute
- Subscribe to RSS Feed
- Permalink
- Report Inappropriate Content
Thank you very much. But i can't modify it to bar chart as i need. If i add new dimensions (period, name1, name2) it became incorrect.