Unlock a world of possibilities! Login now and discover the exclusive benefits awaiting you.
- Qlik Community
- :
- All Forums
- :
- QlikView App Dev
- :
- Re: Conditional Flagging
- Subscribe to RSS Feed
- Mark Topic as New
- Mark Topic as Read
- Float this Topic for Current User
- Bookmark
- Subscribe
- Mute
- Printer Friendly Page
- Mark as New
- Bookmark
- Subscribe
- Mute
- Subscribe to RSS Feed
- Permalink
- Report Inappropriate Content
Conditional Flagging
I have data in CSV and I would want to flag the data if it meet the below Criteria. I want that data to create a summary table counting number of Citrizens who fall in the criteria of the parameters below
Criteria Table
| Question | Norm |
| D.O.B | 01/01/1990 - 31/12/2000 |
| Family Size | Numeric |
| Employment Status | All Except Retired |
| Education Level | High School (or) Primary (of) Both |
| ID | Alphanumeric |
| TransactionType | Credit Card (&) Cash |
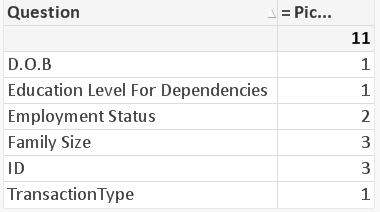
Expected Summary results
| Question | Number Of Citizen |
| D.O.B | 1 |
| Family Size | 3 |
| Employment Status | 2 |
| Education Level For Dependencies | 1 |
| ID | 3 |
| TransactionType | 1 |
That for example if the question is D.O.B then it will count the number of citizen who have the response which fall in between 01/01/1990 & 31/12/2000; if the question is Employment Status then it counts all the Citizens with employment status which is not Retired ......... etc.
Accepted Solutions
- Mark as New
- Bookmark
- Subscribe
- Mute
- Subscribe to RSS Feed
- Permalink
- Report Inappropriate Content
Check this?
Using Straight table chart.
Add Question as Dimension
Expr:
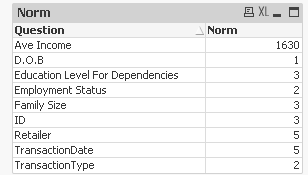
= Pick(Match(Question, 'Ave Income','D.O.B','Education Level For Dependencies','Employment Status','Family Size','ID','Retailer','TransactionDate','TransactionType'),
Sum(Response), Count({<Response = {'>=01/01/1990 <= 31/12/2000'} >} CitizenCode),
Count({< Response = {'High School, University','Primary , Collage','University , Primary , High School'} >}CitizenCode),
Count({< Response -= {'Retired'} >}CitizenCode),
Count(CitizenCode),
Count(CitizenCode),
Count(CitizenCode),
Count(CitizenCode),
Count({< Response = {'Credit Card','Cash'}>}CitizenCode)
)
You can change the expression accordingly.
Your Load will be like:
DATA:
LOAD CitizenCode,
Question,
Response
FROM
[Citizen Info With Parameters.csv]
(txt, codepage is 1252, embedded labels, delimiter is ',', msq);
- Mark as New
- Bookmark
- Subscribe
- Mute
- Subscribe to RSS Feed
- Permalink
- Report Inappropriate Content
Check this?
Using Straight table chart.
Add Question as Dimension
Expr:
= Pick(Match(Question, 'Ave Income','D.O.B','Education Level For Dependencies','Employment Status','Family Size','ID','Retailer','TransactionDate','TransactionType'),
Sum(Response), Count({<Response = {'>=01/01/1990 <= 31/12/2000'} >} CitizenCode),
Count({< Response = {'High School, University','Primary , Collage','University , Primary , High School'} >}CitizenCode),
Count({< Response -= {'Retired'} >}CitizenCode),
Count(CitizenCode),
Count(CitizenCode),
Count(CitizenCode),
Count(CitizenCode),
Count({< Response = {'Credit Card','Cash'}>}CitizenCode)
)
You can change the expression accordingly.
Your Load will be like:
DATA:
LOAD CitizenCode,
Question,
Response
FROM
[Citizen Info With Parameters.csv]
(txt, codepage is 1252, embedded labels, delimiter is ',', msq);
- Mark as New
- Bookmark
- Subscribe
- Mute
- Subscribe to RSS Feed
- Permalink
- Report Inappropriate Content
Like this? May be Helps
- Mark as New
- Bookmark
- Subscribe
- Mute
- Subscribe to RSS Feed
- Permalink
- Report Inappropriate Content
is there a way of doing it in script in the event that they are a lot of conditions.
- Mark as New
- Bookmark
- Subscribe
- Mute
- Subscribe to RSS Feed
- Permalink
- Report Inappropriate Content
I think it is kind of tricky may be possible but need to group by the fields and create individual fields for each Question and expression. Personally Pick(Match()) in the chart expression is more feasible option. If time permits will try script level. Sorry about that.
- Mark as New
- Bookmark
- Subscribe
- Mute
- Subscribe to RSS Feed
- Permalink
- Report Inappropriate Content
Thanks.