Unlock a world of possibilities! Login now and discover the exclusive benefits awaiting you.
- Qlik Community
- :
- All Forums
- :
- QlikView App Dev
- :
- Re: How to create averge line into multiple line c...
- Subscribe to RSS Feed
- Mark Topic as New
- Mark Topic as Read
- Float this Topic for Current User
- Bookmark
- Subscribe
- Mute
- Printer Friendly Page
- Mark as New
- Bookmark
- Subscribe
- Mute
- Subscribe to RSS Feed
- Permalink
- Report Inappropriate Content
How to create averge line into multiple line chart
Hi all,
I attached my raw data and desired output in Excel File.The line chart is monthly basis. The chart will show monthly trend lines for each model, and also want to add the monthly simple average line for all models.
I also uploaded my QV file, it seemed wrong in expression. It is right for average but wrong for model trends.
Can anyone help me please.
- « Previous Replies
- Next Replies »
Accepted Solutions
- Mark as New
- Bookmark
- Subscribe
- Mute
- Subscribe to RSS Feed
- Permalink
- Report Inappropriate Content
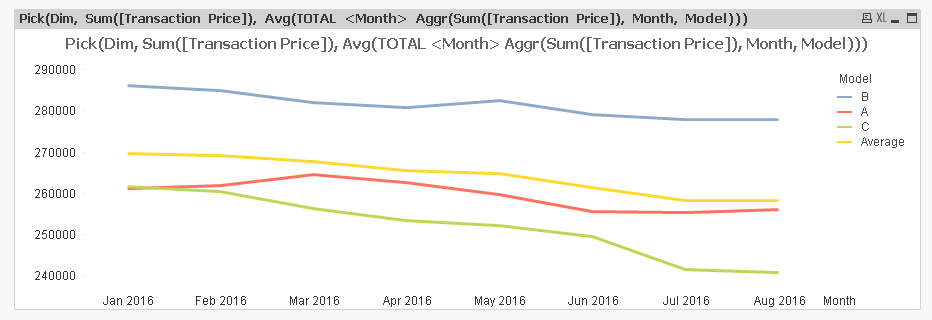
So you want to see only the average for the three models selected? Try this:
Pick(Dim, Sum([Transaction Price]), Avg(TOTAL <Month> Aggr(Sum([Transaction Price]), Month, Model)))
- Mark as New
- Bookmark
- Subscribe
- Mute
- Subscribe to RSS Feed
- Permalink
- Report Inappropriate Content
Hi Jerry,
I am unable to open your .qvw because of License issue my side.But you can view
in the Expression tab -->left hand side below you can find the Trend Lines Section.
there you can find the Average is a Check box and select that check box for your specified expression.It will show the average line chart.
- Mark as New
- Bookmark
- Subscribe
- Mute
- Subscribe to RSS Feed
- Permalink
- Report Inappropriate Content
May be like this 
Check the attahced file.
-nagarjun
- Mark as New
- Bookmark
- Subscribe
- Mute
- Subscribe to RSS Feed
- Permalink
- Report Inappropriate Content
Hi Nagarjun,
Thanks for the quick response.
But I want to automated update for the line charts.
That is to say if I choose models in the filter table, the line chart will updated at the same time.
Thanks
- Mark as New
- Bookmark
- Subscribe
- Mute
- Subscribe to RSS Feed
- Permalink
- Report Inappropriate Content
I think the average reference line is for each model. Not for average of all models.
Anyway, thanks for your idea
- Mark as New
- Bookmark
- Subscribe
- Mute
- Subscribe to RSS Feed
- Permalink
- Report Inappropriate Content
@Sunny T Can you kindly help me on this???
Very very appreciated
- Mark as New
- Bookmark
- Subscribe
- Mute
- Subscribe to RSS Feed
- Permalink
- Report Inappropriate Content
Writing my name like this doesn't send me any notification . I luckily saw this post... I am taking a look at this and will let you know if I find a solution
- Mark as New
- Bookmark
- Subscribe
- Mute
- Subscribe to RSS Feed
- Permalink
- Report Inappropriate Content
So lucky my friend.
Thanks for your kind help.
- Mark as New
- Bookmark
- Subscribe
- Mute
- Subscribe to RSS Feed
- Permalink
- Report Inappropriate Content
In object properties > Presentation > Reference Lines
You can add expression and color in it.
-Ashok
- Mark as New
- Bookmark
- Subscribe
- Mute
- Subscribe to RSS Feed
- Permalink
- Report Inappropriate Content
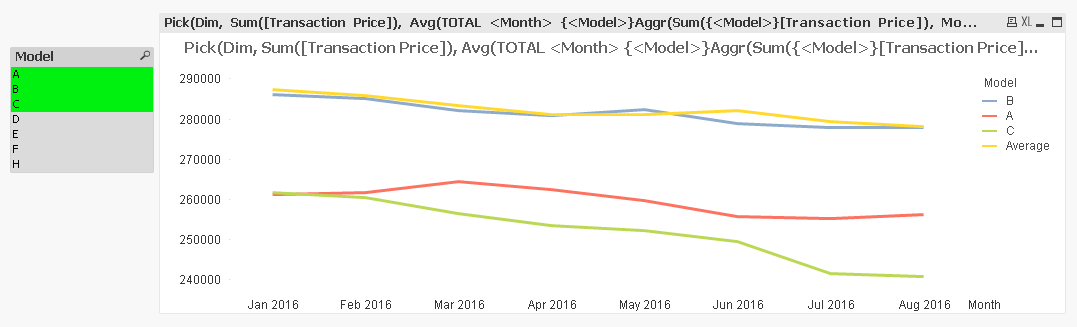
Is this what you want?
Script:
test:
LOAD Month,
Model,
[Transaction Price]
FROM
[Data test.xlsx]
(ooxml, embedded labels, table is Sheet1);
Dim:
LOAD * Inline [
Dim
1
2
];
Dimensions:
Month
=Pick(Dim, Model, 'Average')
Expression:
Pick(Dim, Sum([Transaction Price]), Avg(TOTAL <Month> {<Model>}Aggr(Sum({<Model>}[Transaction Price]), Month, Model)))
- « Previous Replies
- Next Replies »