Unlock a world of possibilities! Login now and discover the exclusive benefits awaiting you.
- Qlik Community
- :
- All Forums
- :
- QlikView App Dev
- :
- Re: How to draw bubble and line in one chart?
- Subscribe to RSS Feed
- Mark Topic as New
- Mark Topic as Read
- Float this Topic for Current User
- Bookmark
- Subscribe
- Mute
- Printer Friendly Page
- Mark as New
- Bookmark
- Subscribe
- Mute
- Subscribe to RSS Feed
- Permalink
- Report Inappropriate Content
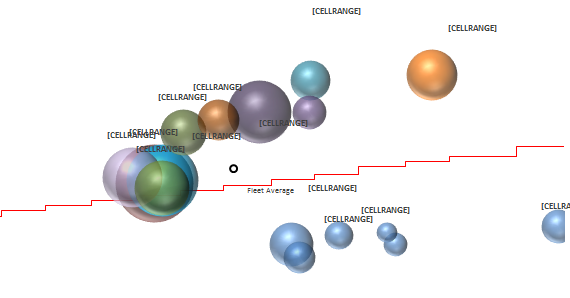
How to draw bubble and line in one chart?
Anyone know how to draw bubble and line in one chart?
Bubble means the products, radius means the volume.
The step chart is to show the score limit.
My colleague draw this chart in excel.
Now I need to achieve this chart in Qlik View.
- « Previous Replies
-
- 1
- 2
- Next Replies »
- Mark as New
- Bookmark
- Subscribe
- Mute
- Subscribe to RSS Feed
- Permalink
- Report Inappropriate Content
I create a line chart as well as scatter chart, change the Transparency of scatter chart to 100% and Layer to Top and place it over to line chart. But when I make some selections, the axis of two Chart cannot Change synchronous. The superposed Charts will become chaos.
- Mark as New
- Bookmark
- Subscribe
- Mute
- Subscribe to RSS Feed
- Permalink
- Report Inappropriate Content
The data of the two charts must be completely linked? Cause I load data from two table, it's hard to link the two tables.
- Mark as New
- Bookmark
- Subscribe
- Mute
- Subscribe to RSS Feed
- Permalink
- Report Inappropriate Content
If data charts are referring data from two different tables respectively and these two tables are not linked to each other then one charts will not change based on selection on another chart. Adding more to it, to fix this problem you can make use of Container object or Conditional features.
Also refer the below link:
Please correct me if I misunderstood it.
Regards!
Rahul Pawar
- Mark as New
- Bookmark
- Subscribe
- Mute
- Subscribe to RSS Feed
- Permalink
- Report Inappropriate Content
Hi Rahul Pawar,
1. My bubble chart also need to show the size. But the combo chart cannot show the size of the bubble.
2. I don't think the container can solve my problem. Because I need to show my bubble chart and the Line chart at the same time.
3. What do you mean by conditional features? Where can I add condition in my chart?
Best regards!
Cai LI
- Mark as New
- Bookmark
- Subscribe
- Mute
- Subscribe to RSS Feed
- Permalink
- Report Inappropriate Content
3. What do you mean by conditional features? Where can I add condition in my chart?
Show Conditional functionality is same as Container object; using which we can show/hide chart object based on condition.
Regards!
Rahul Pawar
- « Previous Replies
-
- 1
- 2
- Next Replies »